


by David Moran, on Feb 26, 2018 11:40:41 AM
Freezing rain impacted much of the Central and Southern Plains beginning Tuesday and continuing into Thursday of last week. Aspects of this storm ranging from warnings to various radar perspectives could be seen in the RadarScope, Weather Radio, and WeatherOps apps.
Let's begin by looking at a radar image across Oklahoma and Texas from Wednesday, February 21, in WDT's Weather Radio app. Green and yellows represent rain, red shades freezing rain, and blue is snow.
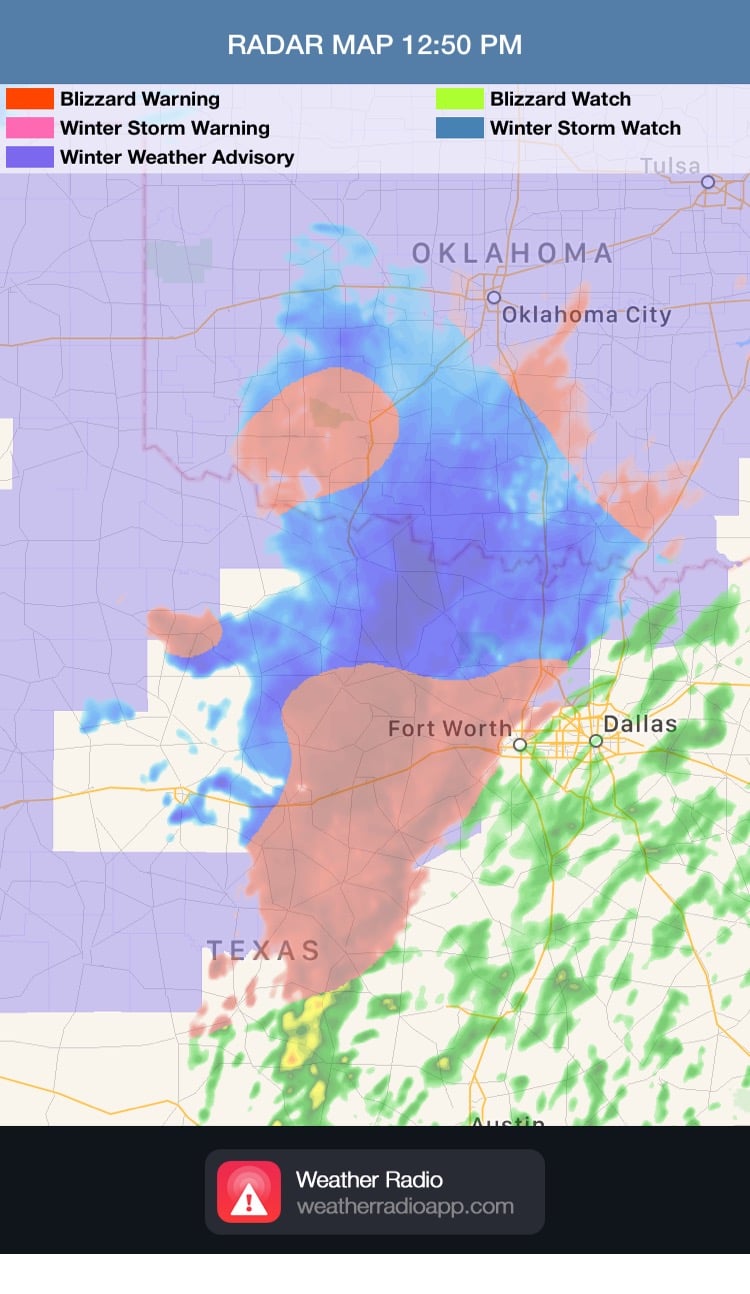 NWS Advisories and Radar 12:50pm CST 2/21/18
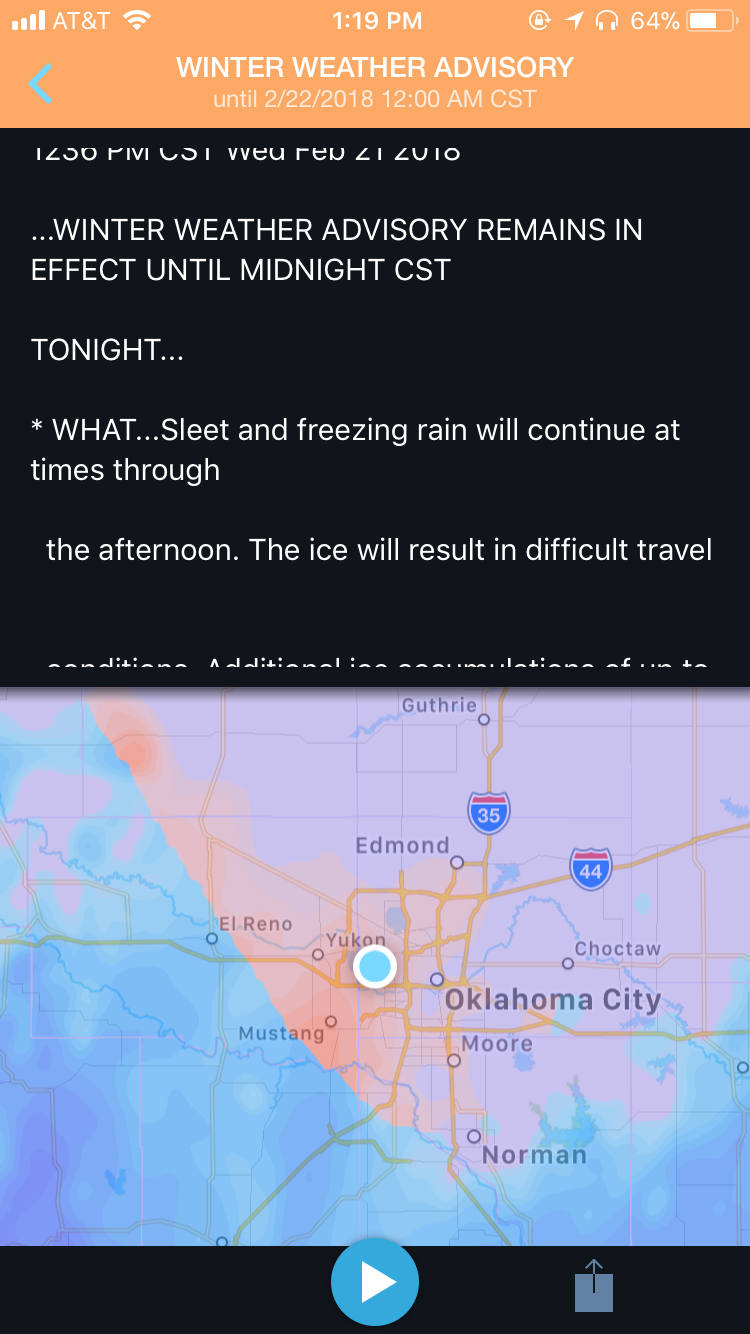
Winter Weather Advisories, shown in purple in the above image, were in effect for a significant portion of Oklahoma and Texas. Here is part of an advisory text from WeatherOps app for the Oklahoma City metro area.
 NWS Advisories and Radar 12:50pm CST 2/21/18
Perhaps the most interesting images from the event come from RadarScope. Precipitation in southwestern Oklahoma began during the late morning. The image below shows Precipitation Depiction and Correlation Coefficient from the Frederick, Oklahoma radar.
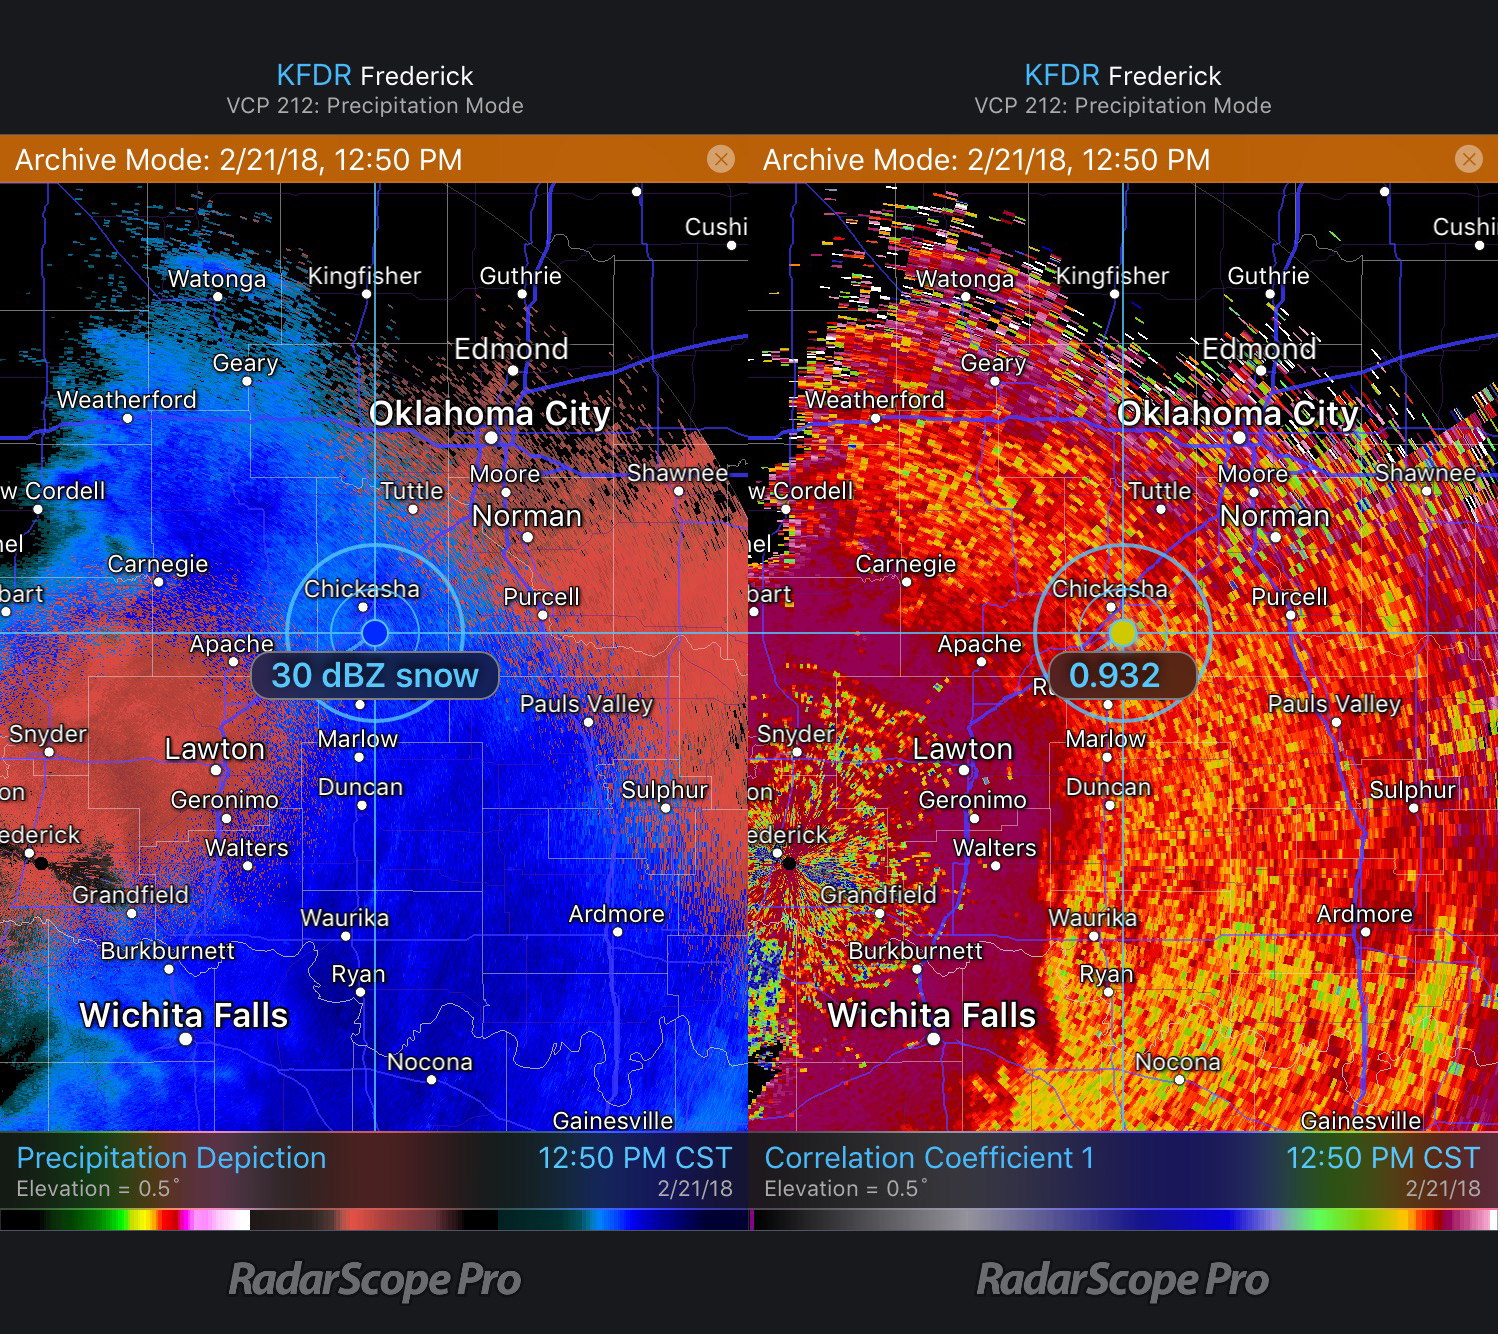 Frederick, Oklahoma Precipitation Depiction and Correlation Coefficient 12:50pm CST Wednesday
There are a few things worth noting in this image. The Correlation Coefficient product indicates how much variability there is in a radar sample. Values closer to 1 indicate echoes that are relatively homogeneous; as the value of Correlation Coefficient decreases, the more variance there is in what the radar is observing. The red shades, such as those extending from New Cordell southeast to Lawton, and Walters indicate that there's minimal variability in what the radar is observing (precipitation is reasonably uniform). Further east from Weatherford to Duncan to Waurika and points eastward, Correlation Coefficient values decrease slightly. This indicates more variability in what the radar is sampling, meaning this could be a mixture of both frozen and liquid precipitation.
On Thursday, February 22, thundersleet was reported across portions of western Oklahoma. Lightning was observed across much of central Oklahoma. In comparing the precipitation depiction to the Correlation Coefficient at 10:45 am, areas of high reflectivity are approximately collocated with slight depressions in Correlation Coefficient. These depressions likely indicate some areas of mixed precipitation (freezing rain, sleet, and/or snow). Lightning was also observed close to some of these depressions in correlation coefficient, likely indicating areas of thundersleet.
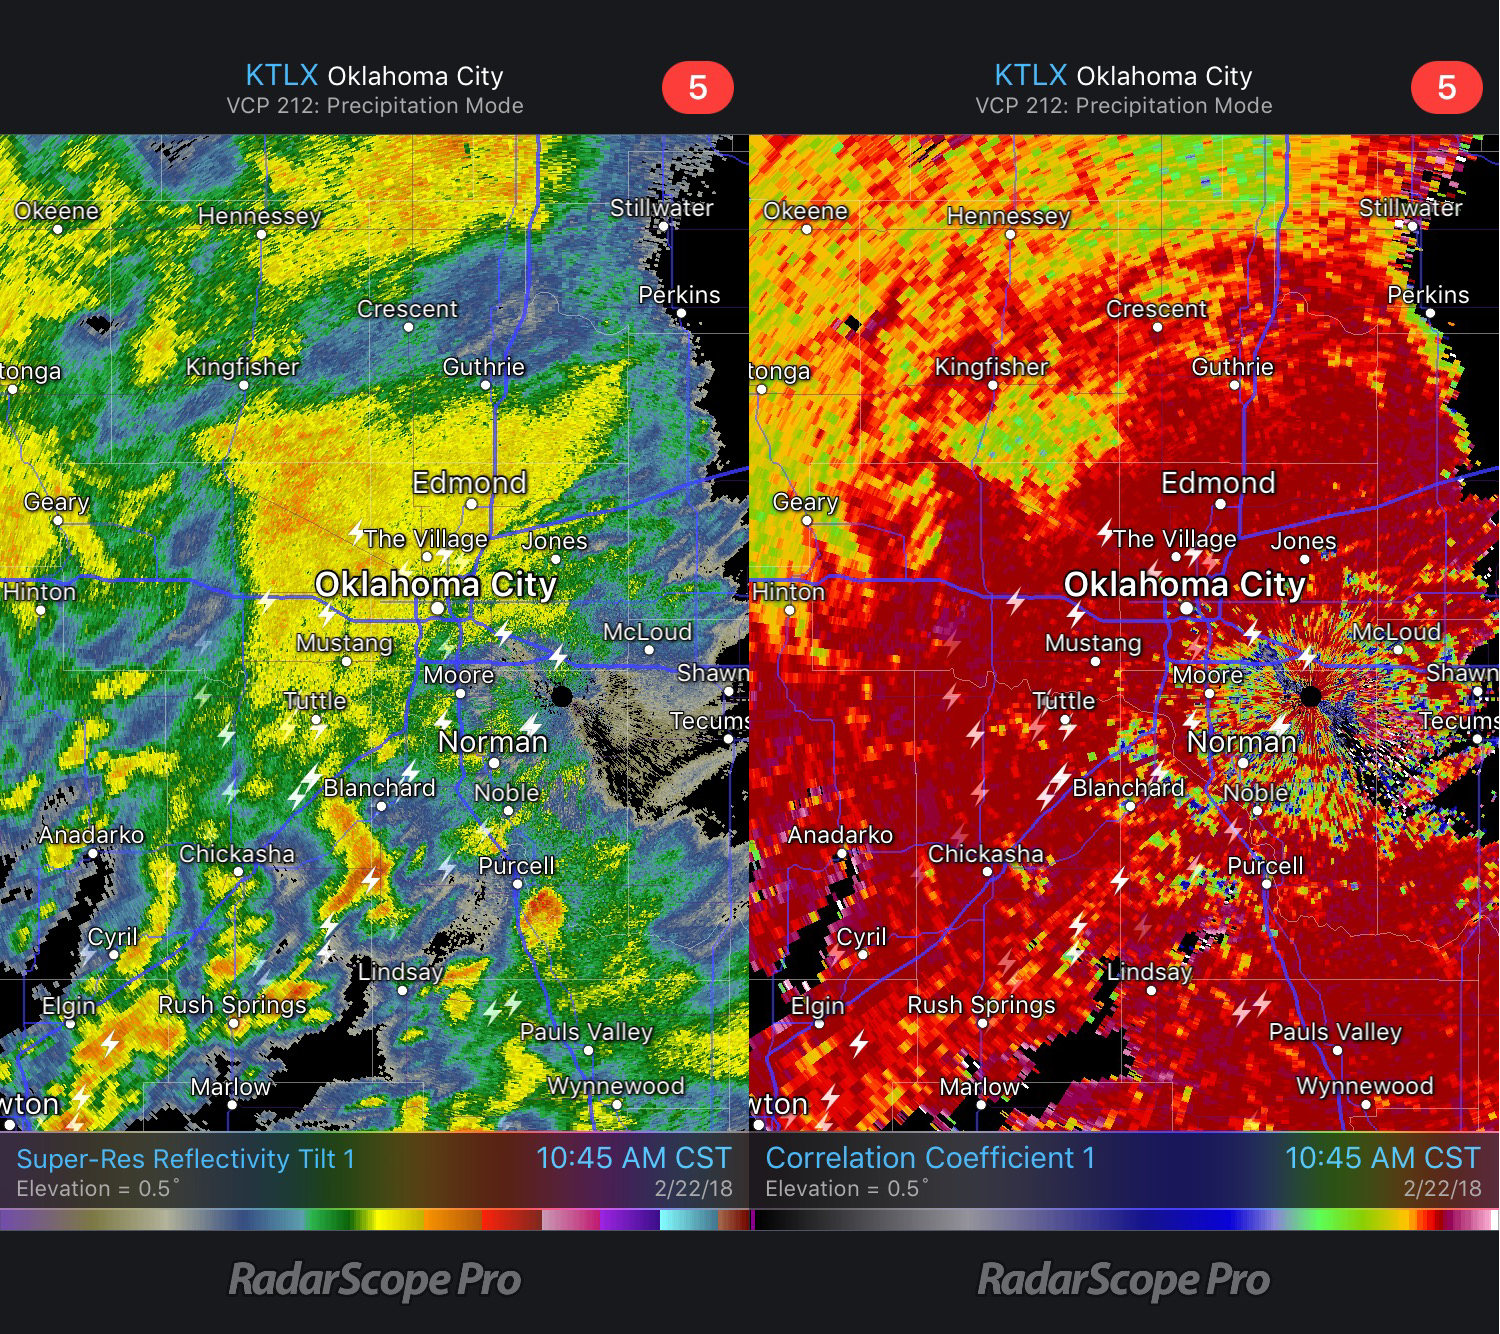 Base Reflectivity and Correlation Coefficient 10:45am CST February 22, 2018
Here is another view of the thundersleet event comparing Precipitation Depiction to reflectivity. What looks like regular thunderstorms on the right are seen to be mixed freezing precipitation by viewing the image on the left. You can also see mPING reports overlaid on the radar data which were helpful in determining whether sleet or freezing rain was falling.
 Loop of Thundersleet Event
This winter precipitation event that took place between February 20 and 22, 2018, provided an opportunity to observe many different precipitation types using various radar products in RadarScope. Correlation Coefficient also provided a method to identify where more than one precipitation type was occurring. These products, in conjunction with other products available within RadarScope, can give a complete picture of what may be happening. Using these three apps, you can stay up to date on how winter precipitation may impact your area.

