by Stephen Strum, on Jun 4, 2018 2:26:07 PM
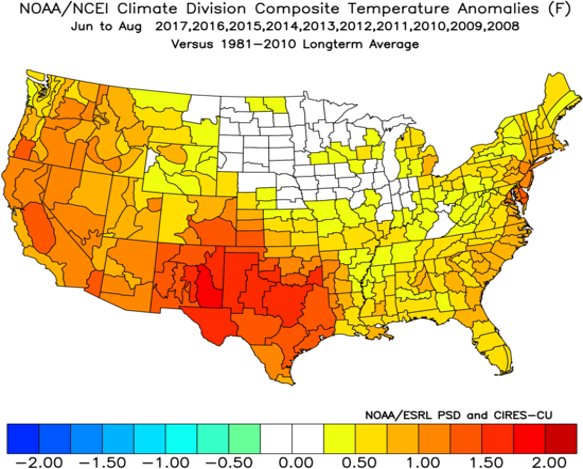
After a wild spring season that featured the 2nd coldest April and warmest May on record since 1981, summer 2018 is shaping up to be warmer than normal across most of the country, though not quite as hot as in some recent years. Because the last decade has seen some sweltering summers, the average summer temperature over the previous ten years is much warmer than the 30-year normal. Note also that the higher population areas of the East and West Coasts, as well as all of the southern US, have trended warmer while the lower population areas of the north-central US have seen little to no warming trend. So, not only have summers been trending warmer, but that warming trend has primarily been focused on the higher population areas of the country.
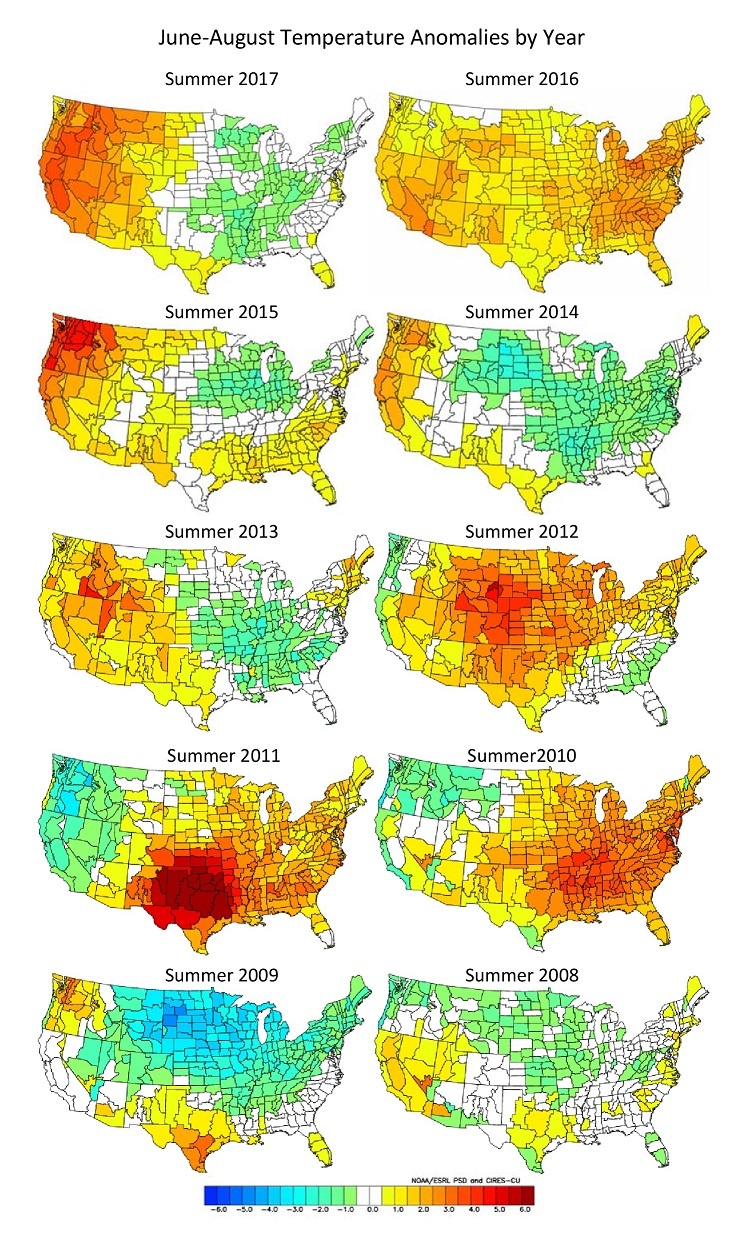
The plots below show the summer temperature anomalies for each of the last ten years. While there have been some sweltering summers, some cooler summers have also been seen, most notably 2009 and 2014. However, summers 2010, 2011, 2012 and 2016 all rank among the hottest on record for the country as a whole.
If we look at the entire May-September period, a distinct warming trend can be seen when looking at Cooling Degree Day (CDD) totals. Cooling Degree Days are a measure often used to help project electricity demand related to air conditioning usage and are accumulated when the average temperature on a given day exceeds 65°F. So, a day with an average temperature of 85°F would see 20 CDDs, while a day with an average temperature of 55°F would see 0 CDDs. If we average the CDDs from points across the country on each day and then sum them up for the entire May to September period each year, we get the following graph. Note that the values for 2018 are current forecast values.
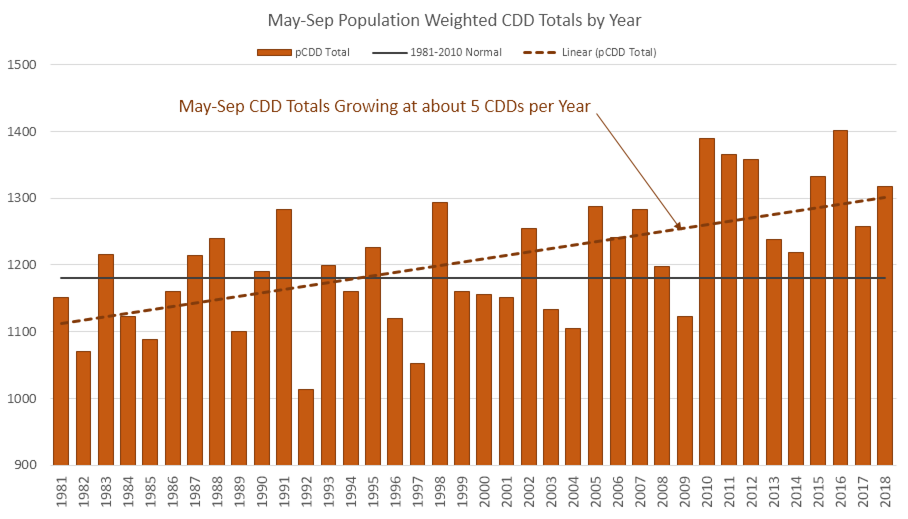
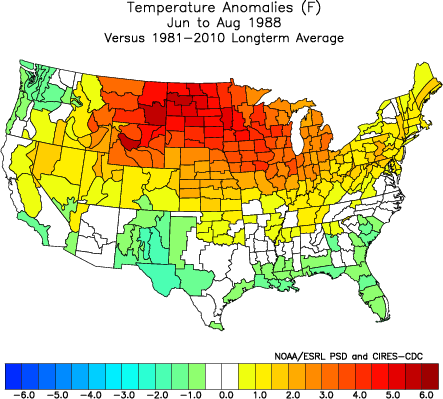
The bottom line is that summers have been trending warmer during recent decades, and the five hottest summers since 1981 on a CDD basis have all occurred in the last eight years. Also of note is that on a population-weighted CDD basis (where higher population areas are weighted more in the total), the country has averaged warmer than normal each of the past eight years. A summer like 2015 averaged below normal across the Midwest, but the significant population areas along the East Coast, across the South, and along the West Coast all averaged warmer than normal, skewing the population-weighted total higher. Other hot summers, like 1988 shown below, saw heat focused across the Plains and Midwest where populations are lower, and so summer CDD totals weren’t very high even though large swaths of the country saw record heat.
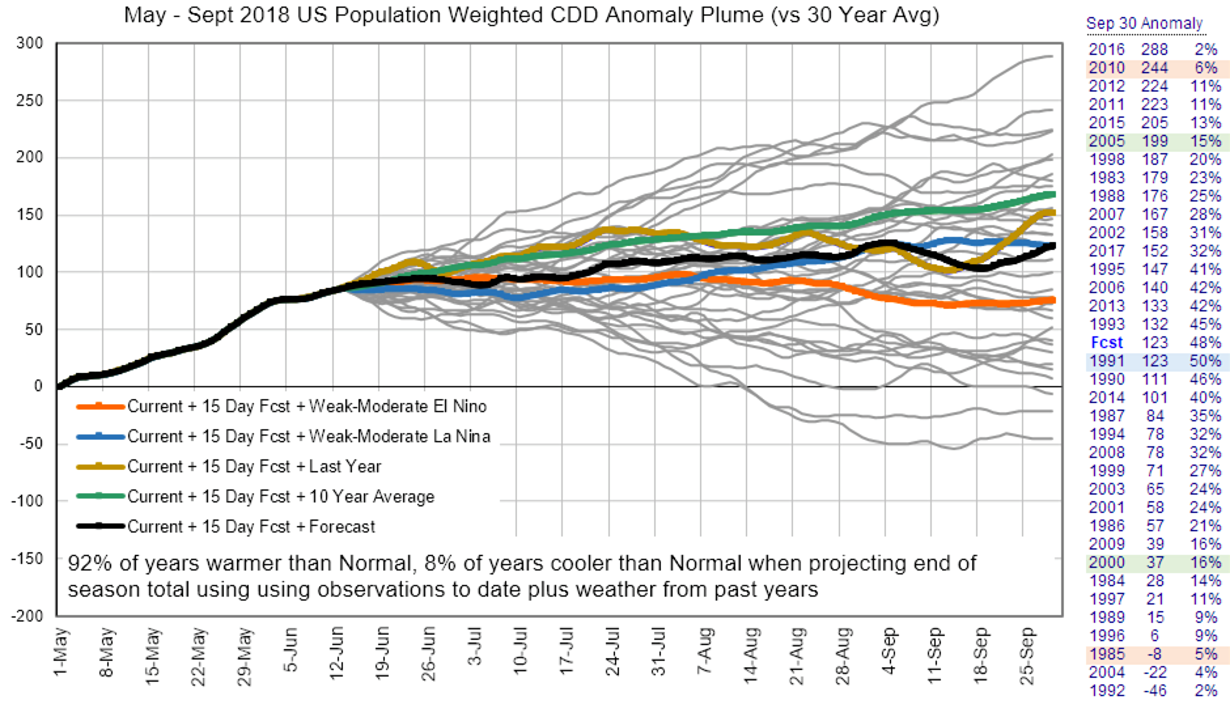
Given the record warm start to the May-September period we have had this year, we can try to project what the odds are that the entire period will average above or below normal. If we take actual weather conditions for past years and append them to the current year’s observed weather, we get the following plot of May-Sep CDD anomalies. For these particular calculations, the 30-year normal being used is 1,180 CDDs, so the numbers shown are anomalies from that value. The black line is our current forecast, with the green line the 10-year average weather, the orange line is the average for years with weak-to-moderate El Niño conditions and the blue line the average for years with weak-to-moderate La Niña. Note that the El Niño average tails off during August and September, so if we do see an El Niño develop late this summer (a possibility), then the last third or so of the summer season could end up cooler than the first half to two-thirds of the summer. But, historical data tells us that there is a 94% probability that the May-September average will be warmer than normal just by the extremely unusual conditions seen during May. We have only seen two summers since 1983 that were cool enough from this point forward to cancel out the warm anomalies seen during May and make the entire May-September period average below normal.
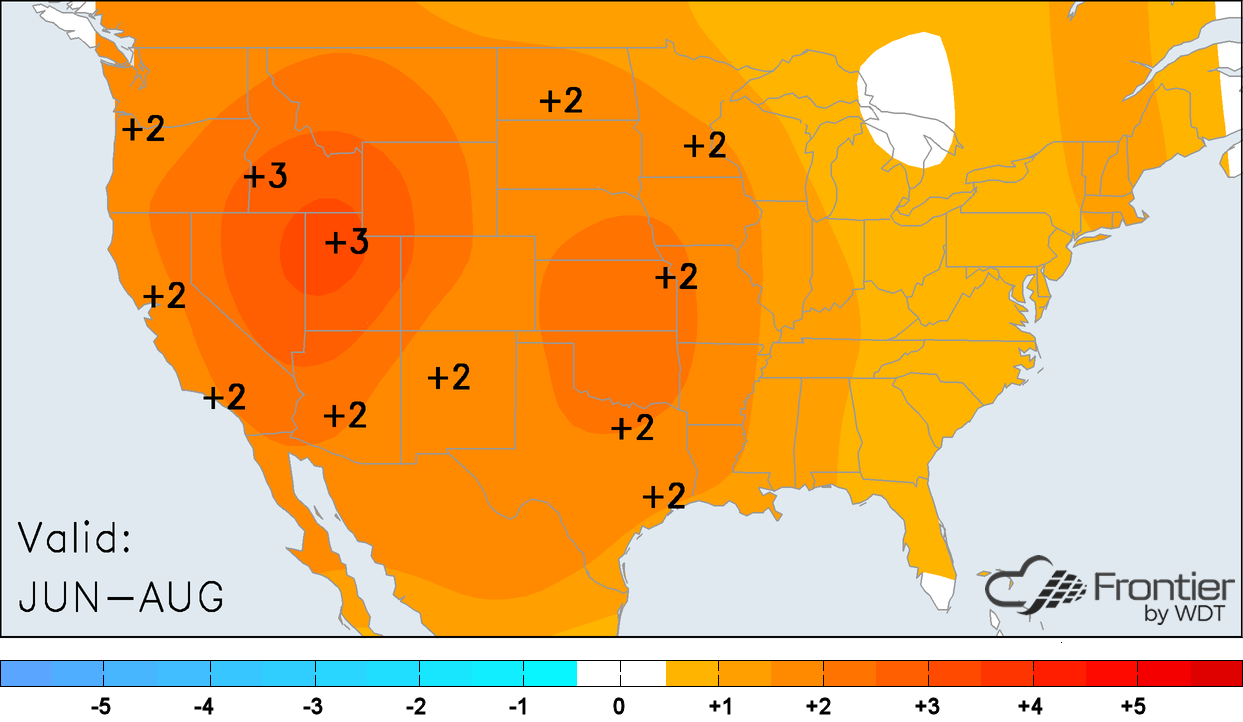
Regarding the temperature pattern this summer, we expect the strongest warm anomalies to be located across the central and western US with the eastern US averaging closer to normal, though still somewhat above normal. The map below shows the June-August forecast.
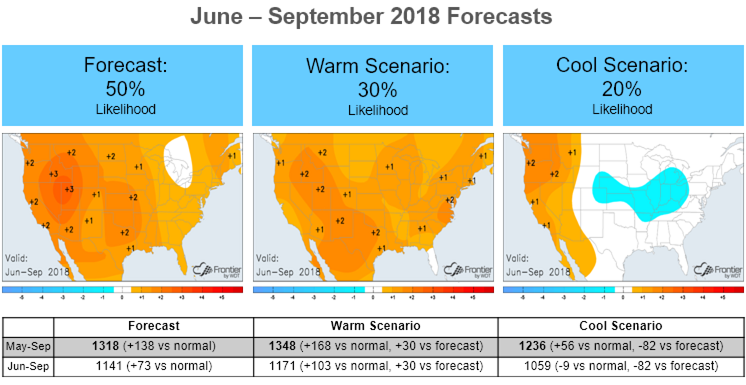
If we look at the June-September period, here are some projections and probabilities. If El Niño gets going quickly this summer, then August and September could end up cooler, and the June-September period could end up near to below normal east of the Rockies. If El Niño fails to develop at all by fall, and the atmosphere remains in some type of La Niña mode, then more widespread heat will be possible, and the balance of the warm season could end up even warmer than forecast.
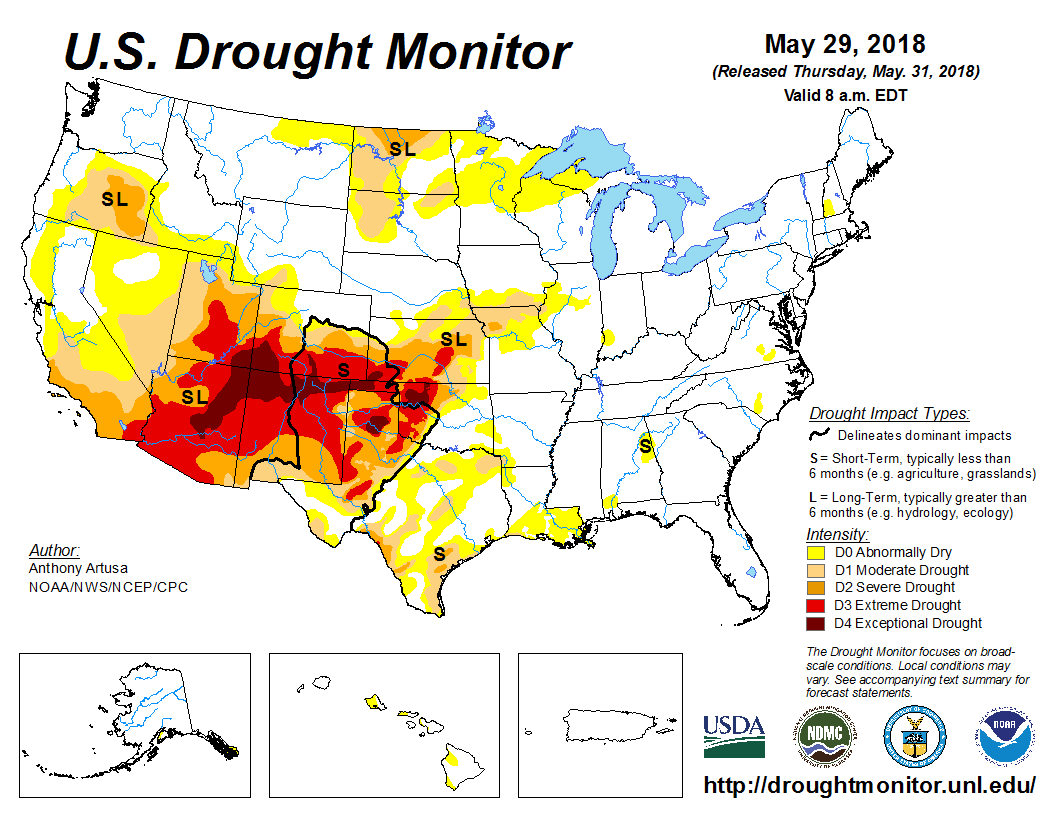
In any event, odds for warmer than normal temperatures are highest across the central and western portions of the country. Drought areas of the southwestern and south-central US will be most at risk for excessive heat given the expected atmospheric pattern and tendency for dry ground to heat up faster.
 If you can’t take the summer heat, at least take comfort in knowing that the fall season and cooler weather are just three months away and before long we can begin thinking about next winter.