May 3, 1999: Understanding Probability as Applied to Weather Forecasting
by Stephen Strum, on May 3, 2017 1:49:27 PM
Recently, we had a question about why the Storm Prediction Center (SPC) was forecasting only a 5% chance for tornadoes on a severe weather day. The implication of the question was that there would then be a 95% chance that no tornadoes would occur. So, I thought I would discuss what a 5% chance for a severe event actually means, and if that is a meaningful forecast. It's time to learn more about how probability and weather forecasting work hand-in-hand and why meteorologists take so many math classes.
Since probabilities for precipitation or severe weather are generally given as the chance that an event will occur at a given location or within a specified radius of a given location, the probability forecast can be thought of as the combination of the chance that an event happens and the coverage of that event. Something like:
Forecast = Probability of Event Happening X Percent Coverage of Event
So, say there is a 50% chance of rain on a given day. In one scenario, there might be a 100% chance that rainfall will occur, but it will be showery in nature and only half the forecast area will see rainfall. So, the probability that rain falls at a given location will be:
Forecast = 1.00 x 0.50 = 0.50 or 50% chance of rain
In another scenario, maybe a solid line of thunderstorms is expected to develop along a cold front, but it is uncertain if the storms will develop before moving through the area. So, 100% of the area will see rain if the storms develop before the front moves through, but there is only a 50% chance the storms develop before the front moves into the area. So, the forecast in that case would be:
Forecast = 0.50 x 1.00 = 0.50 or 50% chance of rain
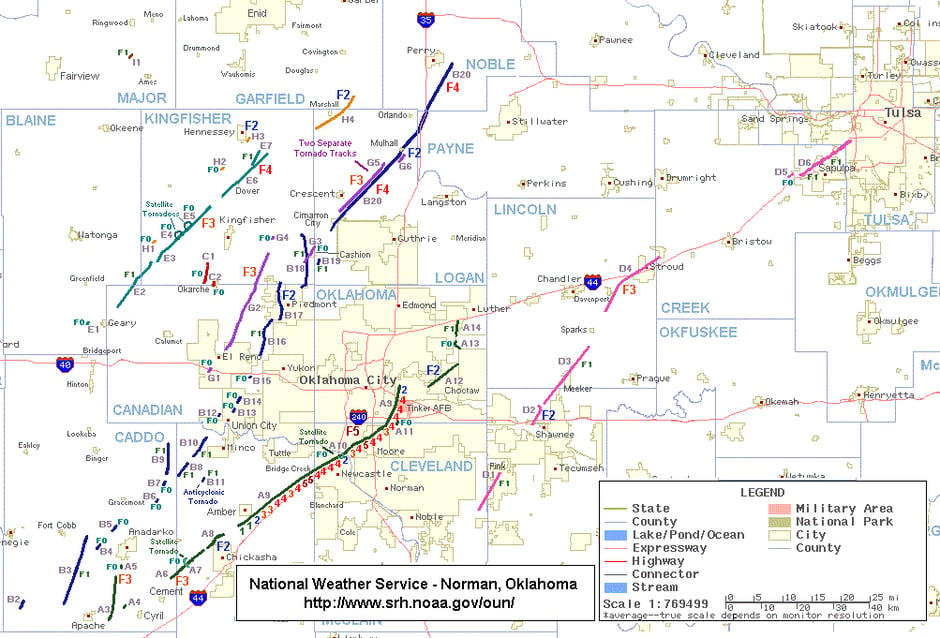
Since severe weather is usually much more isolated than rainfall, particularly hail and tornadoes, the probabilities are always going to be quite low, even if confidence in the event happening is near 100%. To show an extreme example, lets look at the historical May 3, 1999 tornado outbreak, and specifically the tornadoes that occurred in central Oklahoma. The map below shows the nearly 60 tornadoes that occurred across central Oklahoma on that day. Note that additional tornadoes were observed across other parts of Oklahoma as well, but outside of the boundaries of the map shown. The region of Oklahoma shown on the map is roughly 160 miles by 110 miles for a total area of 17,600 square miles. You can view a listing of all the individual tornadoes that occurred during that outbreak across the central US here:

I used the data on the Wikipedia page to a calculate the total area that was directly impacted by tornadoes in the region shown on the map. There were 59 tornadoes that tracked across roughly 128 square miles of the region shown on the map. That is an estimate though since the tornadoes varied in width during their life cycle and a constant width was used for the entire track. In any event, if we divide the 128 square miles covered by the 17,600 square miles of the region shown on the map, we see that 0.73% of the map area was directly impacted by a tornado on May 3, 1999, a record tornado outbreak day. The bottom line is that even in an extreme event, the percent of a forecast area that sees a tornado is very low. This can present a forecasting dilemma. If you try to forecast the probability that a given point will see a tornado, you will essentially never forecast a probability greater than 1%. A forecast for a 1% probability for a tornado would likely be highly misunderstood, since most users wouldn’t understand how significant that really is. Clearly, if the May 3, 1999 event is only worth about 1% coverage, then most events will be far less than that.

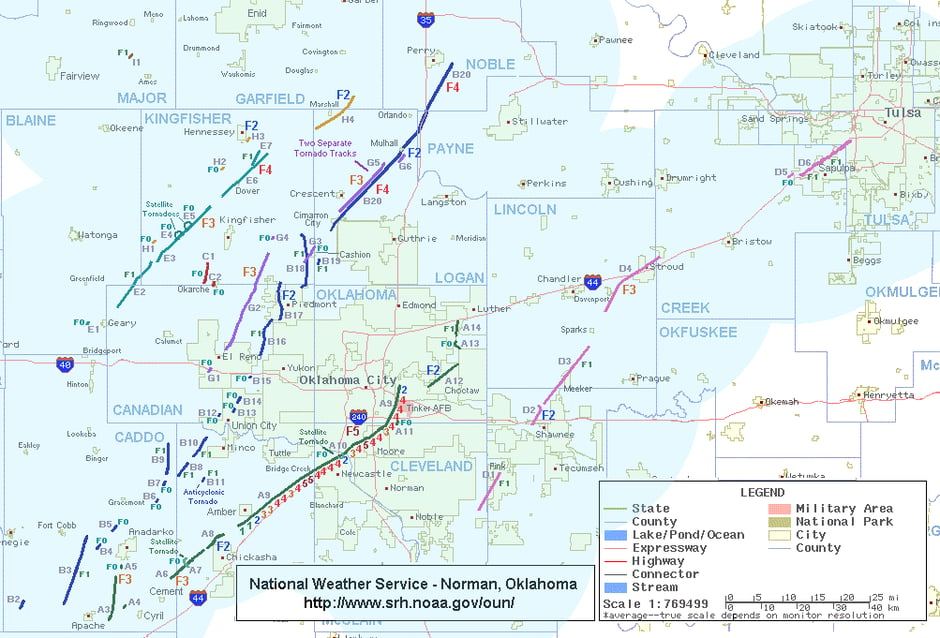
So, in order to better convey the risk for a tornado, the SPC gives the probabilities in terms of a tornado happening within 25 miles of a given point. If we take the same event but shade in the areas of the map that are within 25 miles of a tornado track, we get the following map:
As can be seen, the majority of the region was within 25 miles of a tornado on that day. The shaded area is roughly 14,500 square miles in area, or about 82.5% of the map area. Obviously the distribution of tornadoes can dramatically vary the total area that is within 25 miles of a tornado track, but this presents a good estimate for how an extreme event would verify in terms of how SPC produces their forecasts. If we were to divide the percent area covered by the number of tornadoes it would work out to about 1.4% per tornado. Again, since there is a huge difference between a brief tornado and one that tracks for 30 miles in terms of area impacted, that number will vary, but it can be used as a back of the envelop way to help translate a tornado probability forecast. So, for 5% of this same region to be within 25 miles of a tornado, you might need 3-4 tornadoes, a more typical tornado outbreak.
Of course, the forecast numbers always include the actual probability that there will be tornadoes as well, so you could only estimate 3-4 tornadoes over the region from a 5% forecast if there was 100% certainty that tornadoes would occur. But, this gives you a crude way to estimate what kind of tornado outbreak might happen based on a given forecast. The bottom line is that a 5% chance for tornadoes implies there is a good chance for the area to see a few tornadoes. If there is 10-20% chance of a tornado with 25 miles of a point over a given region, that implies a major tornado outbreak is possible, so stay alert!
If you need a weather forecast, WeatherOps will help your business weather the storm with a full suite of advanced products. Looking for something more long term? We've got that too with Frontier's medium and long range outlooks.


