


by Phillip Spencer, on Nov 19, 2018 1:43:12 PM
Weather radar data is useful to both the professional meteorologist and the interested nonprofessional for—among other things— tracking dangerous thunderstorms (containing, for example, deadly lightning, damaging hail, and tornadoes), locating significant wind shifts and surface boundaries (e.g., drylines and fronts), and even tracking bats flying out of their caves and from under bridges looking for their next meal. The topic of this blog is to discuss how weather radar can be used to estimate precipitation accumulations. Along the way, we will mention some problems with these estimates and describe how the impact of those problems can be mitigated.
A weather radar sends out pulses of electromagnetic radiation into the atmosphere. If the energy encounters a foreign object such as raindrops, hail, insects, bats, etc., a small portion of that energy is reflected to the radar and is detected by a receiver. In general, the higher the number of foreign objects in the air, the higher the amount of energy that will make its way back to the radar receiver. For example, heavy rainfall will reflect more energy to the radar receiver than light rainfall. So, the amount of energy received by the radar receiver (i.e., the reflectivity) can be used as a proxy for the rainfall intensity (i.e., the rainfall rate). It turns out that there are empirical relationships that meteorologists use to relate the reflectivity to the rainfall rate. For example, relationships of the form Z = bRc can be used to estimate the rainfall rate (R) given the reflectivity (Z). Here, b and c are empirical constants for this Z-R relationship. Different combinations of b and c are used depending on the environment. For example, accurate rainfall rate estimates from a moist, tropical environment might require a different pair of constants than estimates from a dry, continental environment. If the rainfall rates (from the Z-R relationship) are summed over a period of time, then we may obtain estimates of accumulated precipitation at each point in the radar domain.
Although the radar-derived accumulated precipitation values generally provide a pretty good ballpark estimate of the actual accumulated precipitation, the estimates are not perfect. There are several reasons for this. First, no Z-R relationship perfectly describes the relationship between reflectivity and rainfall rate—it’s an empirical relationship with empirical constants. Second, attenuation of the radar energy from intervening storms may distort the precipitation estimates from distant storms. Third, different shapes and sizes of hydrometeors reflect energy differently. For example, hail within a storm can cause an overestimation of the rainfall rates (and, therefore, an overestimation of the precipitation accumulation). Fourth, the presence of non-hydrometeors (e.g., dust, insects, birds) can provide false, non-zero estimates of rainfall. Although not all-inclusive, these are a few of the reasons for errors in the radar-derived estimates of precipitation accumulation.
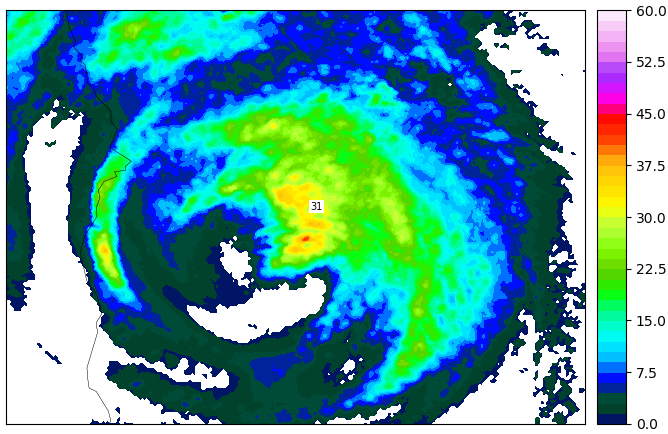
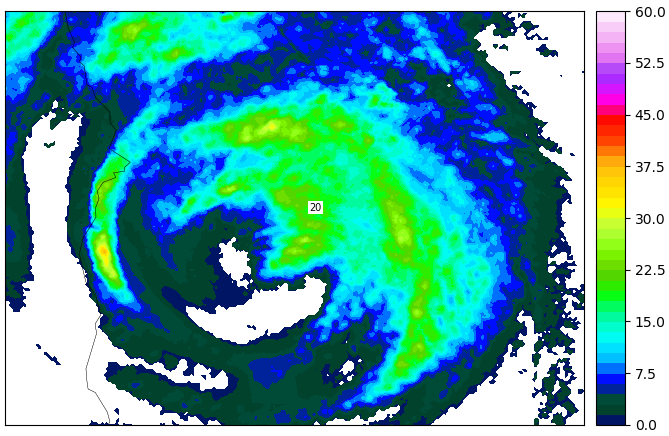
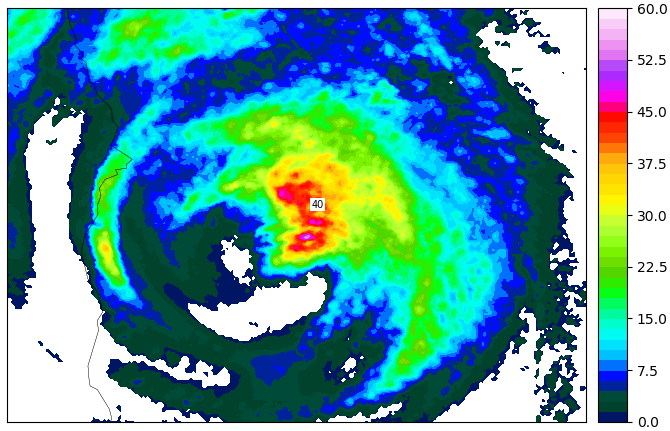
Although there are a multitude of reasons for errors in radar-derived precipitation estimates, we can reverse the impact of those errors by adjusting the radar-derived estimates via the use of actual rain gauge observations. This gauge-correction technique allows us to produce better precipitation accumulation estimates across the radar domain than could be obtained from merely summing the results of the application of a Z-R relationship. For example, consider the three figures below, which show precipitation accumulation estimates during a one-hour period as the remnants of hurricane Michael traversed the southeastern United States during 11 October 2018. The first figure shows the raw, radar-derived precipitation accumulations (mm). The boxed value (31 mm) is the radar-derived accumulation estimate at that point. For the sake of demonstrating how the gauge-correction technique works, let’s assume that there’s an actual gauge observation of 20 mm at the location where the radar-derived estimate is 31 mm (see the second figure). The gauge-correction technique aims to adjust the radar-derived estimation to be consistent with the observed value. Similarly, let’s now assume that the actual gauge observation of one-hour precipitation accumulation is 40 mm rather than 20 mm. In this case, the gauge-correction technique accurately adjusts the accumulation estimates upward (see the third figure).
There are a couple of things to note about the gauge-correction technique. First, the adjustments are made not just at the locations of the gauge observations—adjustments are made at all locations “near” the gauge observations; that is, information about the differences between the radar-derived estimates and the observed accumulations is spread spatially so that a smooth analysis of precipitation accumulation is produced. On a related note, radar-derived estimates “far away” from any gauge observation do not get adjusted, since it is unclear how the radar-derived estimate should be modified (if at all).
The simple examples above illustrate the gauge-correction technique using a single, hypothetical gauge observation. In reality, WDT has access to 20,000+ real-time, quality-controlled gauge observations across the contiguous United States and adjacent parts of Canada and Mexico from our partner MetStat, Inc. Other gauge networks could be used to gauge-correct precipitation accumulations across different parts of the globe.
