


by Phillip Spencer, on Jul 17, 2018 2:25:07 PM
Over the past few decades, solar panels have advanced to capture as much of the power of the sun as possible. Among other things, these solar panels can convert solar radiation into electricity to power homes and businesses. A large-scale application of solar panels at a site (solar farms) can generate enough electricity to power hundreds or even thousands of homes and businesses. Another essential function of solar radiation is to help plants and crops grow via photosynthesis.
To help industries (such as energy and agriculture) make sound business decisions, state-sponsored global model forecast output contains information about the amount of solar radiation impinging upon the earth’s surface at hundreds of thousands or even millions of grid points. Unfortunately, the data encompass 3-hour periods early in the forecast period and even larger 6- or 12-hour periods later in the forecast period. [Output from the 0.5° Global Forecast System (GFS) encompass 3-hour periods out to forecast hour 240 and 12-hour periods thereafter out to forecast hour 384; output from the 0.25° European Centre for Medium-Range Weather Forecasts (ECMWF) encompass 3-hour periods out to forecast hour 144 and 6-hour periods thereafter out to forecast hour 240.]
Alas, for industries that need high temporal resolution (e.g., hourly) forecasts of solar radiation, model output encompassing 3-, 6-, or 12-hour periods may not suffice. For this reason, WeatherOps has developed a system to intelligently disaggregate the 3-, 6-, and 12-hourly global model forecast data into hourly intervals based on our knowledge of the daily solar cycle at any point of interest.
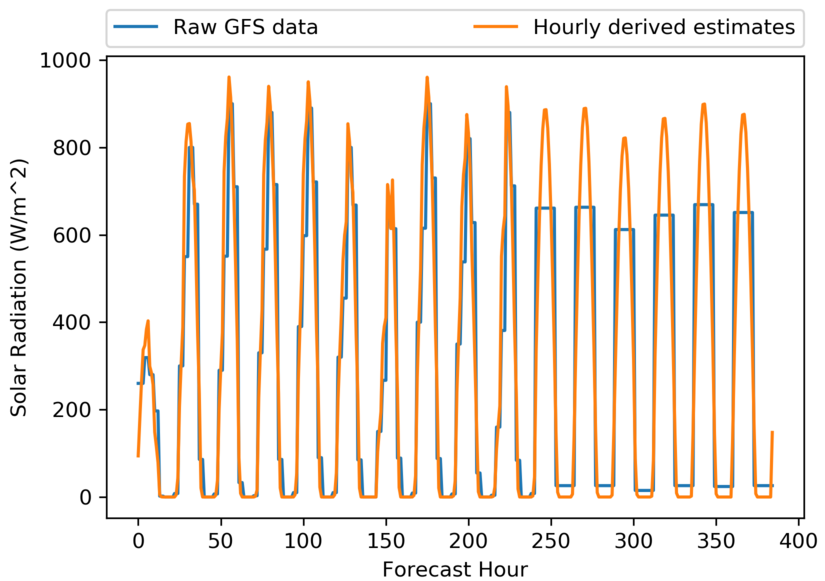
A sample (for Sioux Falls, SD during June 2018) of raw GFS solar radiation forecast data (blue curve) and the WeatherOps-derived hourly solar radiation estimates (orange curve) out to 16 days (384 hours) is presented in the first figure. For GFS data, the solar radiation variable represents the average solar radiation over a 3- or 12-hour forecast period. For example, the average solar radiation for the 12-hour period centered near forecast hour 250 is about 650 W m-2. [This feature of the GFS solar radiation variable explains the stair-step nature of the blue curve. For the ECMWF, the solar radiation variable represents the total accumulated solar radiation since the beginning of the forecast.] Clearly, the WeatherOps-derived hourly estimates of solar radiation provide a much better depiction of the daily solar cycle than the raw model output, especially at forecast lengths exceeding 10 days, where the differences in the curves exceed 200 W m-2 during peak heating.
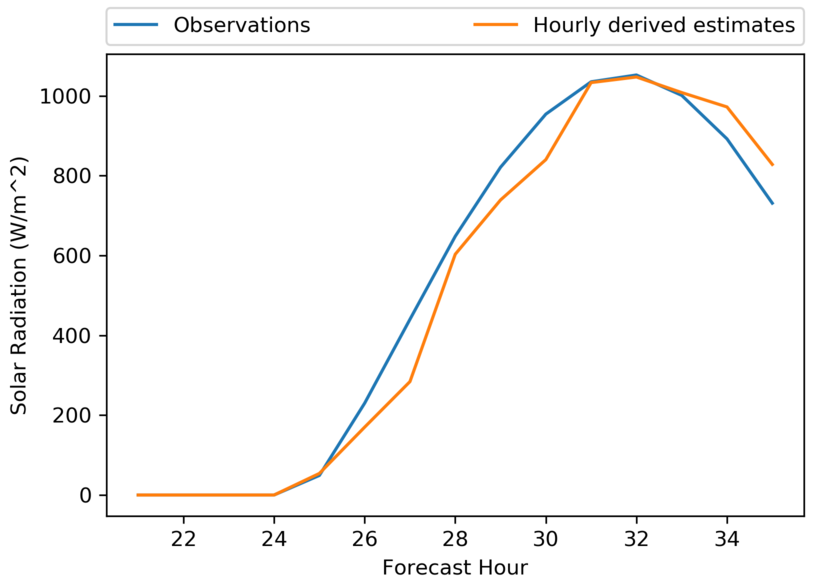
The second figure shows the time series of observations of downwelling solar radiation at the surface at Desert Rock, NV during a 15-hour period in June 2018 (blue curve) and the associated WeatherOps-derived hourly solar radiation estimates computed from GFS forecast data (orange curve).
In summary, by intelligently disaggregating raw model forecast data, a significant improvement in solar radiation forecasts is available to industries that require accurate, hourly estimates for their assets.
