Don’t Ignore Wind Generation when Estimating Weekly Natural Gas Demand
by Stephen Strum, on Feb 1, 2017 2:37:00 PM
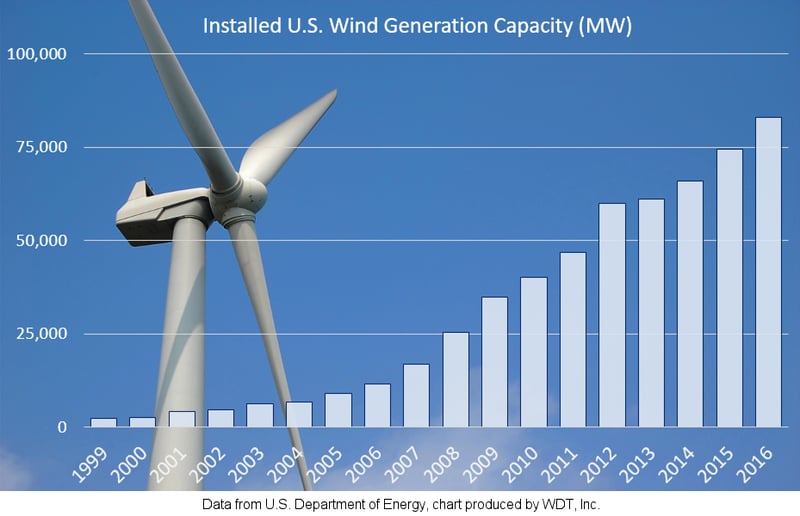
As the number of installed wind generation facilities across the U.S. increases, so does the total available generation capacity. With total installed wind generation capacity now well past 75,000 Megawatts (MW) and racing towards 100,000 MW, wind generation is having a growing impact on the total consumption of other fuel sources used to produce electricity.

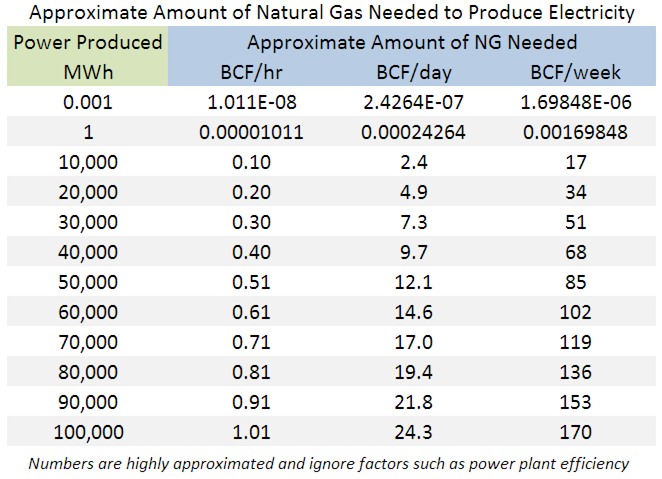
The table below shows the amount of natural gas needed to produce a given amount of electricity for an hour, day or week per data from the U.S. Energy Information Administration (EIA). This table can be used to help estimate the potential impact of wind generation on weekly natural gas demand and thus weekly storage injections and withdrawals. For example, if an average of 30,000 MW of electricity is produced during a given week from wind power sources, then up to 51 BCF (billion cubic feet) of natural gas won’t be needed to generate the same electricity. The total amount of natural gas demand offset by wind power may be less than that value though since natural gas only fuels about one-third of all U.S. electricity generation.

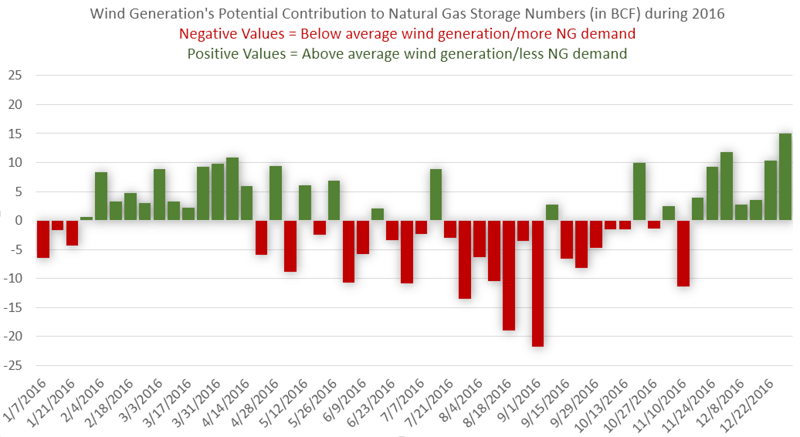
So, when wind generation is lower than average, more electricity will need to be generated from other fuel sources. The end result is that during a week with unusually high levels of wind generation there will be less natural gas utilized to generate electricity, resulting in larger storage injections during summer or smaller withdrawals during winter. Likewise, when the wind is light and generation from wind facilities is lower than average, more natural gas will likely be used to generate electricity resulting in a smaller storage injection or a larger withdrawal. The graph below shows the maximum potential weekly contribution to the natural gas storage numbers during 2016 as measured by differences in wind generation from the 2016 annual average. Again, since only about one third of U.S. electricity is generated by natural gas the actual weekly contributions to natural gas demand may be less than shown. However, even if the numbers in the chart are reduced to one-third of the values shown, large week-to-week variations in wind generation output can still influence the weekly natural gas storage numbers by several BCF.

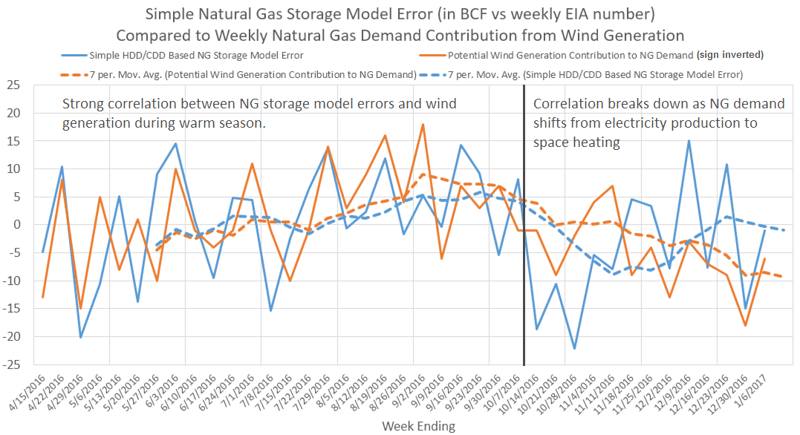
To further illustrate the importance of wind generation on natural gas demand, a simple weekly storage model was created based on weekly U.S. total Heating Degree Day (HDD) and Cooling Degree Day (CDD) values. The forecast errors from that model, as compared to the weekly storage numbers reported by the EIA, were then compared to the potential contribution to NG demand from wind generation. Since average wind generation is indirectly going to be incorporated into most storage models by virtue of the average impact on natural gas consumption, deviations from the average will be most influential in producing surprisingly high or low weekly storage numbers. In the following example we are using the difference in observed wind generation from the trailing 12 month average, then converting that difference to a NG demand value in BCF using the data from the previous table. The values of wind generation contribution to the weekly NG demand are sign inverted in the chart to make for an easier visual comparison. Note that the correlation between wind generation and NG demand is highest in the warm season when NG demand is driven largely by electricity production, and much lower once colder weather arrives and NG demand is driven primarily by space heating. If we add in wind generation to our simple NG storage model, the mean absolute error falls from 8.6 BCF per week to 7.7 BCF per week, and when looking at just the warm season it falls from 7.9 BCF to 6.8 BCF per week. So, factoring in wind generation has the potential to provide a meaningful improvement to natural gas storage modeling, and that improvement is likely to increase as wind generation capacity increases in the future.

At WDT, we produce wind generation forecasts for nearly every wind farm in the country, and aggregate that data to state, national, and ISO level. We also now produce data files and graphics with the estimated natural gas offset and potential contribution to the weekly storage number. Sign up for a free trial and see if our wind generation data can help improve your natural gas storage modeling.


