


by Noah Lock, on Jul 24, 2018 2:06:21 PM
Radar is an excellent tool for assessing storms, and soundings are an excellent tool for understanding why the atmosphere does what it does. Much of the unusual weather in Oklahoma last week can be explained from a single, well-chosen sounding.
Caution: Advanced meteorological terminology ahead!
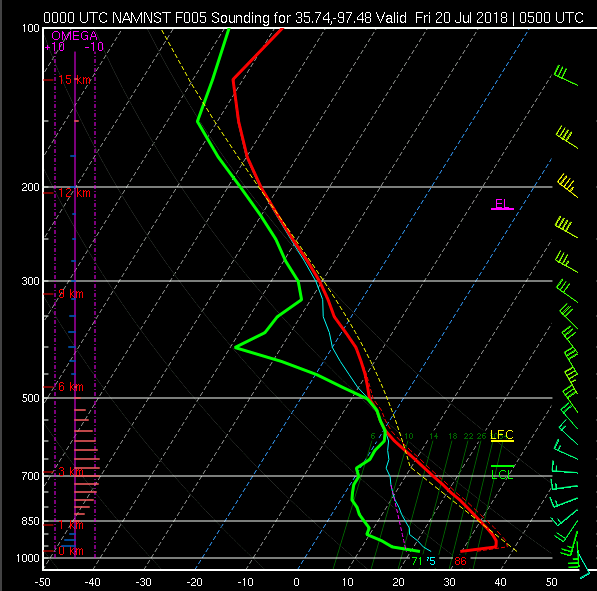
The axes of the plot are pressure (vertical, constant values shown in solid gray lines) and temperature (horizontal, but the angled dashed lines indicate the constant values). Some heights relative to the ground are also shown on the left. The thin slanted green lines with labels in the lower right of the diagram are mixing ratio lines. The red line represents the atmospheric temperature as a function of height, and the green line represents the atmospheric dew point as a function of height. The slope of the red line from just above the surface to where the green and red lines converge is very close to the dry adiabatic lapse rate (9.8 C/km, the rate at which temperature changes with height for unsaturated air).
On July 19, 2018, it was scorching in Oklahoma. Many areas had high temperatures above 105°F, with two Mesonet stations in far SW Oklahoma reaching 113°F. 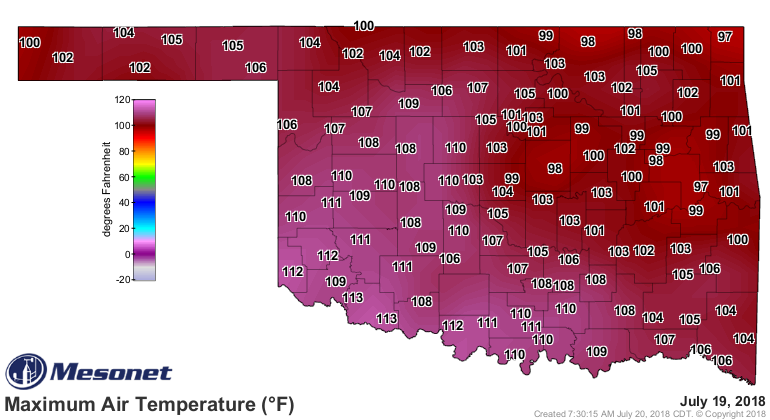
During peak heating, the red temperature line would have maintained the same slope all the way to the ground, which would put the surface value close to 40°C, consistent with observed high temperatures in that area of 103 – 105°F. During the evening, surface temperatures cooled, while temperatures aloft remained hot, creating an inversion, as shown in the sounding. Additionally, air aloft was very dry, leading to a decrease of moisture with height. Both of these factors cause a condition called super refraction (commonly referred to as anomalous propagation or AP), which causes a radar beam to bend back toward the earth more than it usually does. In this case, the beam was hitting the ground and ground-based structures (such as wind turbines) a considerable distance away from the radar, leading to an abundance of ground clutter echoes.
There were also some storms that developed during the afternoon over the high plains and moved into northern Oklahoma by late evening as light showers. These precipitation echoes were embedded in the abundant ground clutter. Without dual-polarization data, it would be challenging to determine which echoes were precipitation and which echoes were clutter. However, dual-polarization data (especially correlation coefficient) makes it rather simple in most cases. The areas of very high correlation coefficient are precipitation, and the low correlation coefficient areas are clutter.
The other interesting development from these light showers was a heat burst. As of last Friday morning, the daily maximum temperature map from the Oklahoma Mesonet showed an isolated region of warmer temperatures north of Oklahoma City, including 99 at Marshall. 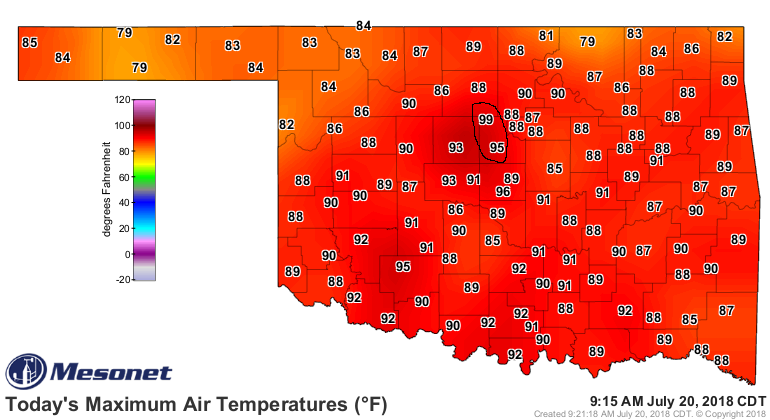
Meteograms for the two stations in that area show the characteristic signature of a heat burst shortly after midnight. There were simultaneous sudden increases in wind speed and temperature, with a decrease in dew point, and all three variables returned to normal within a couple of hours.
Heat bursts are uncommon events that occur in association with dissipating showers or storms. For heat bursts to be observed, they require a deep layer of air aloft that is dry and has large lapse rates, and a shallow inversion near the surface, which is why the usually happen at night during the summer. The sounding shown above indicates that all of these factors are present.
Heat bursts occur as air and precipitation descend from above the dry layer. The precipitation evaporates, which cools the air until it is gone. The combination of evaporation and descent causes the air to warm at the moist adiabatic rate. If the air is still cooler than its surroundings, it will continue to descend, though it will warm at the more rapid dry adiabatic rate once the precipitation is gone. The following image is the same sounding as above, but I added lines to show the properties of the air in the heat burst.

Where the red and green lines converge aloft represents the clouds associated with the showers. I have drawn solid white and yellow lines from the cloud base to the surface that would represent the evolution of air descending from those clouds (temperature and dewpoint, respectively). Initially, both travel together along a moist adiabatic lapse rate (varies with temperature, but always less than 9.8 C/km) because the air is saturated. When the precipitation is gone, they diverge, and the yellow line follows the dry adiabatic lapse rate to the surface.
Two things to note here:
1) The yellow line is to the left of the red line for most of the descent (by about 5 degrees), meaning it is cooler than the environment and will continue to accelerate downward.
2) When it reaches the surface, its temperature is about 38°C, which is consistent with the observed 99°F maximum temperature (and also about 5 degrees cooler than the previous afternoon’s high temperature).
Even though it is warmer than the environment at the surface (thus giving the heat burst signature), that is only true in a very shallow layer, so it did not have time to slow down much. Meanwhile, the white line follows a mixing ratio line to the surface and ends up around 10°C, which is also consistent with the observed minimum dew point of 51°F.
When combined with sufficient understanding of meteorological processes, this one sounding explains the excessive heat, anomalous ground clutter on the radar, and the heat burst. While soundings take some work to understand, they are very powerful tools.
