Weather data and utility bill analytics: Are you doing it right?
by Daphne Thompson, on Oct 12, 2015 3:44:27 PM
After spending a thoroughly informational three days in New Orleans last week for the Utility Analytics Institute's annual Utility Analytics Week conference, I departed with excitement about the tools vendors are developing using weather data and analytics. One such application of weather data increasingly being leveraged by utility analytics companies focuses on the correlation of surface observations -- such as temperature, cloud cover, relative humidity, and even solar radiation -- to utility bills for large commercial or retail customers. The general idea is analysis of such data will provide insight into how changes in weather conditions equate (or don't equate) to changes in usage.
The importance of utilizing these data sets cannot be overstated, as weather is without question the single most influential variable when it comes to energy consumption. And, while many of these service providers are on the right path, some recent interactions lead me to believe others have yet to incoporate the proper types of weather data into their analytics algorithms. Unfortunately for their clients, the ouputs resulting from the integration of behind-the-curve weather data must be considered flawed.

As a result of the increased adoption of TOU (Time of Use) / VPP (Variable Peak Pricing) rate programs, such as OG&E’s Smart Hours here in Oklahoma, hourly temperature and atmospheric condition data is much more important to analyze than just simple almanac data. This is especially so for high or critical price events, during which time utility customers can be paying up to 10 times the standard off-peak rate.
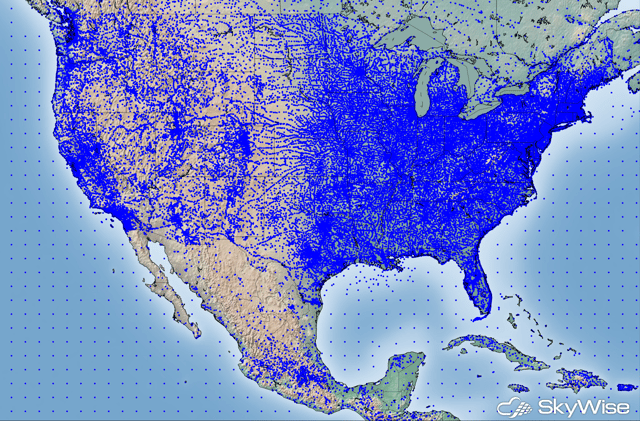
This is where WDT’s SkyWise Mega Feed excels. With several thousand quality-controlled points across the US (and many more globally), a utility bill analytics provider has the ability to tap into a wealth of point-specific weather information. Whether it be hour-by-hour temperature, wind speed, relative humidity, cloud cover, or a slew of other variables, bill analysis can be narrowed down to a much more definitive temporal scale. 
Sure, the high temperature yesterday was 91 degrees, but did the analysis show a cool front moved in at 4pm and knocked the surface temperature down from the high of 91 to 79, leading to a drastic reduction in consumption from 4pm and on?
If Smart Hours, or any VPP program for that matter, has defined hours of increased consumption costs (in this case 2-7pm during the summer months), it is imperative to incorporate the weather data specific to those individual time periods. OG&E, a WDT client, uses this same high-resolution data in its forecasts. Why shouldn’t the analytics company in its utility bill analysis?
As a customer, a question you have to ask your analytics provider is, “What weather data are you using in your alogrithms?” And as a provider, you need to ask your internal data scientists the same question. The tools are there, you just have to ensure the right ones are being used.


