Summer 2017 Summary and Fall 2017 Preview
by Stephen Strum, on Sep 14, 2017 2:31:20 PM
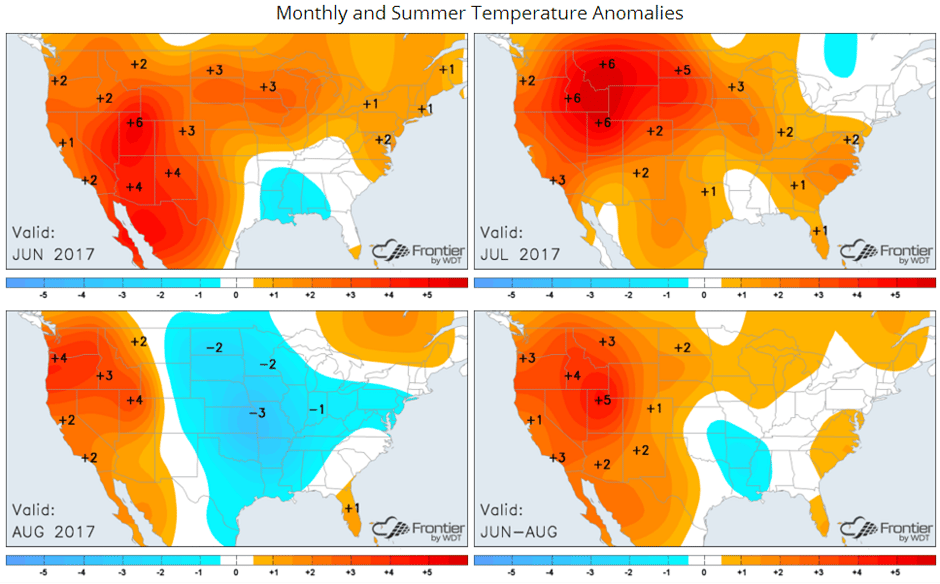
Summer 2017 was hotter than normal for the U.S., ranking 15th hottest on record out of the last 123 years. However, unlike summer 2016, the heat this year was focused on the western half of the country, with the eastern US much more seasonal overall. The plots below show the monthly temperature anomalies for each month of the summer, along with the summer composite.
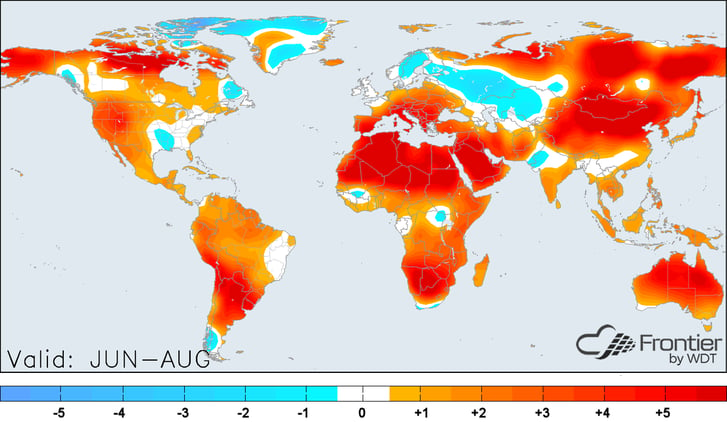
 Globally, the June-August period was warmer than normal in most areas, but pockets of below normal temperatures were still seen, notably across areas of the Arctic and western Asia. Anomalies on this plot and the US plots above are in degrees Fahrenheit.
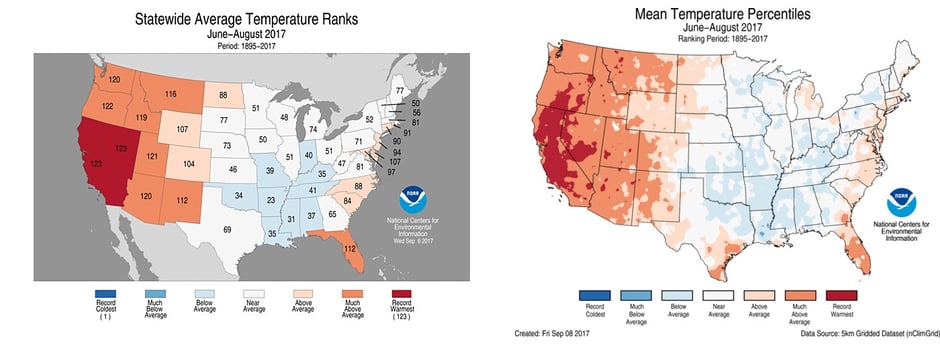
When looking at summer temperatures by state, both California and Nevada ended up with their hottest summer on record, though all areas west of the Continental Divide were quite hot. The East Coast also averaged warmer than normal, but the southern Mississippi Valley region was rather cool. The temperature rankings and percentile maps that follow don’t exactly align with the temperature anomaly maps previously shown since they depict rankings, not actual temperature anomalies. Additionally, the temperature anomaly maps show the temperatures compared to the 1981-2010 normals whereas the maps below rank data over the entire 1895-2017 period.
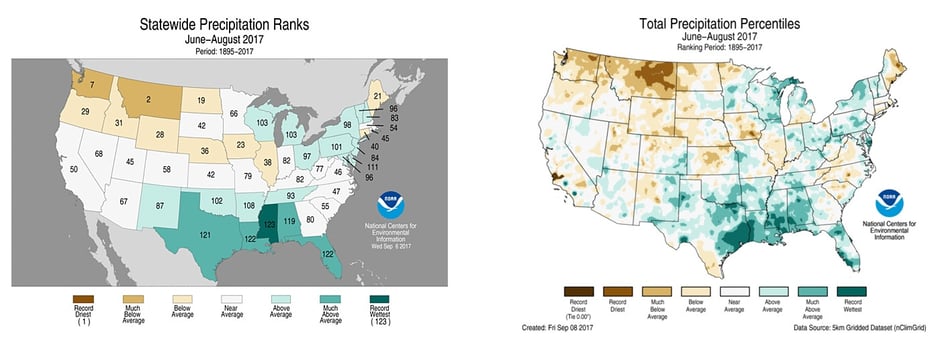
Rainfall was an interesting story this summer as much of the Gulf Coast ended up with record or near-record rainfall, thanks mostly to heavy rainfall from storms Cindy and Harvey. Rainfall across Mississippi was the highest on record for the summer, with Louisiana and Florida finishing 2nd wettest on record and Texas 3rd wettest. While summer 2017 was 3rd wettest on record for Texas, southeastern Texas ended up with their wettest summer on record thanks to Harvey. Conversely, the Pacific Northwest and the northern Rockies were exceptionally dry, with northeastern Washington and north-central Montana seeing their driest summer on record. This dryness followed an unusually snowy winter across much of the West.
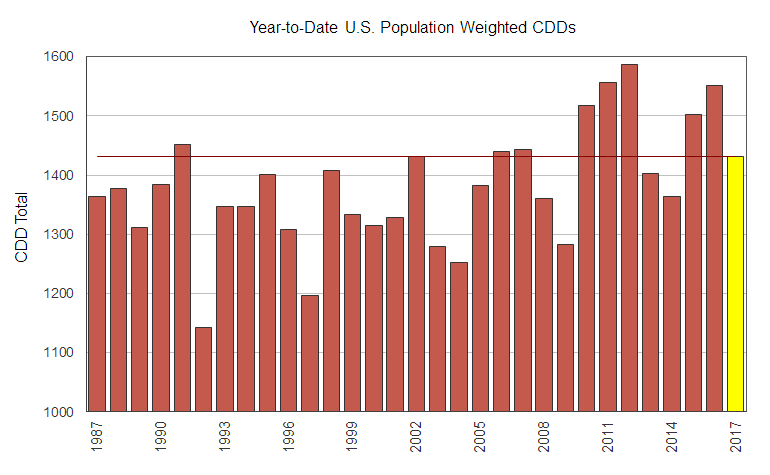
The following plot shows the year-to-date U.S. population weighted CDD totals. Note that these are totals through September 13th. Since population-weighting, the data skews the averages closer to what is seen across the densely populated eastern US, other data that weights temperatures evenly across the entire country (such as NOAA’s data and rankings) will show different results. In any case, this provides a method to compare 2017 to past summers when looking at cooling demand impacts. Summer 2017 was cooler than the previous two summers but warmer than summers 2013 and 2014. Also evident from the plot is how anomalously hot some of the recent summers have been when compared to those in the prior couple of decades.
So, what about fall?
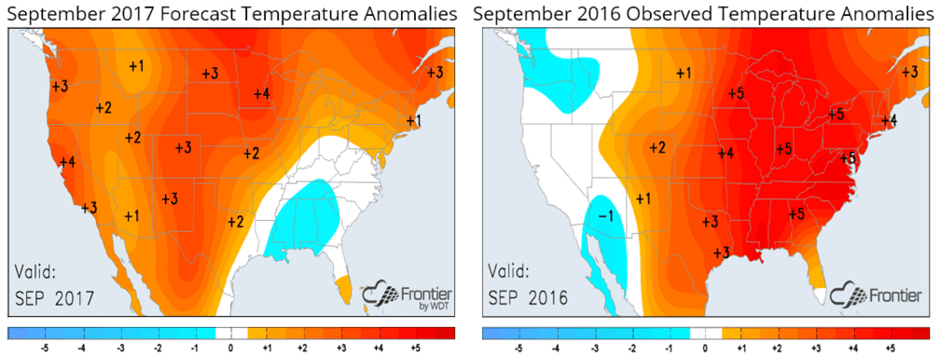
September has continued the pattern of August thus far, with the eastern half of the country cooler than normal and the West quite hot. However, that will be reversing for the second half of the month with the eastern half of the US expected to average above normal while the West trends cooler. Even with the eastern US trending warmer the next couple of weeks, the month as a whole will end up dramatically cooler than September 2016 which featured continued summer heat during much of the month.
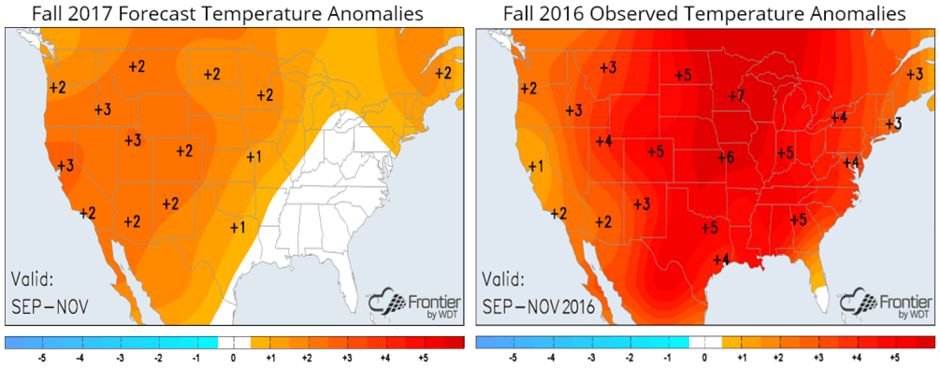
 We expect the eastern US to trend cooler again for a time during October, with the West warming again, so the entire fall season is expected to average close to normal across the eastern third of the country while the western US averages are warmer than normal. While the western half of the country may end up similar to what was seen last year, most of the eastern half of the US should end up much cooler than during fall 2016.
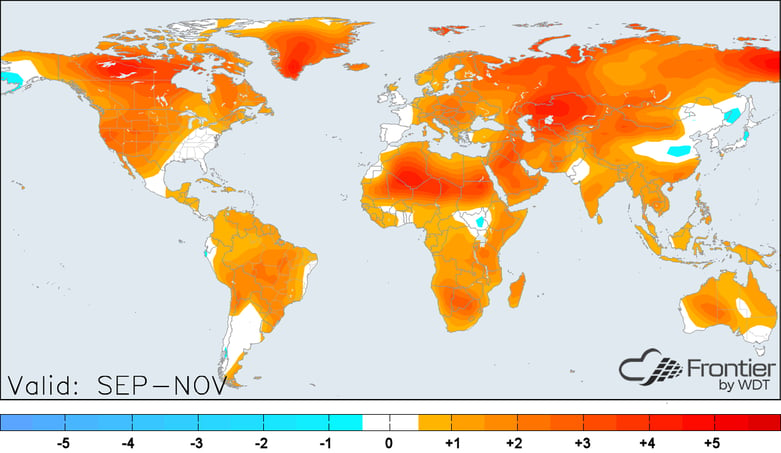
 Globally, we expect the September-November period to average warmer than normal across most areas, with areas of eastern Asia, western Europe and the eastern US forecast to average closer to normal (when compared to the 1981-2010 average).
Since fall has arrived, it is time to start thinking about winter. In the coming weeks we will look at what impacts global SST and tropical convection patterns may have on this coming winter as well as other potential drivers of the winter pattern such as the QBO and AO, so stay tuned!


