Streamplotting Wind Coordinates
by Justin Stewart, on Sep 7, 2016 1:27:30 PM
Let's take a look at how we can create a matplotlib streamplot using Insight API's Wind Direction and Wind Speed location endpoints.
It is recommended that you follow along with this example in a Jupyter notebook.
Prerequisites
Calculating Wind Coordinates
The Insight API provides endpoints for both Wind Direction and Speed, but not for Wind Coordinates (at least not yet). Here's a simple Python function to accomplish this:
from math import sin, cos RPD = 0.01745329 def calculate_uv(wind_speed, wind_direction): u = -wind_speed * sin(wind_direction * RPD) v = -wind_speed * cos(wind_direction * RPD) return (u, v) |
Retrieving the Data
We'll need a bounding box to determine the lat/lon values we'll be using to make calls to the API. Let's use the bounding box surrounding Oklahoma. We'll represent our bounding box as follows:
# (min_lon, min_lat, max_lon, maxlat) bbox = (-103.0, 33.0, -94.0, 37.0) |
Let's start with a precision of one degree for the bounding box grid. We'll need to make a call to both Wind Speed and Direction endpoints for each coordinate:
import numpy as np from skywiseinsight import HourlyWindSpeed as ws, HourlyWindDirection as wd def create_uv_grid(bbox, valid_time, precision=1.0): Y, X = np.mgrid[bbox[1]:bbox[3]:precision, bbox[0]:bbox[2]:precision] V = X * 0 U = X * 0 for x in range(X.shape[0]): for y in range(Y.shape[1]): # Coords lat = Y[x][y] lon = X[x][y] # Call Insight API and Calculate UV wind_speed = ws.location(lat, lon, start=valid_time, end=valid_time).series[0]['value'] wind_direction = wd.location(lat, lon, start=valid_time, end=valid_time).series[0]['value'] u, v = calculate_uv(wind_speed, wind_direction) # Load Data U[x][y] = u V[x][y] = v return { 'X': X, 'Y': Y, 'U': U, 'V': V } |
Creating the Stream Plot
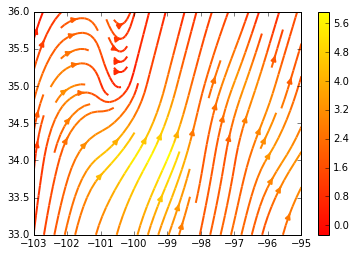
Now that we can obtain all of our necessary values, let's load them into a matplotlib streamplot. It will take some time to complete all of location requests to the Insight API:
We'll show you how to quickly make calls to Insight API asynchronously in a future tutorial.
%matplotlib inline from datetime import datetime import matplotlib.pyplot as plt def plot(): dt = datetime.now() grid = create_uv_grid(bbox, dt) fig0, ax0 = plt.subplots() X = grid['X'] Y = grid['Y'] U = grid['U'] V = grid['V'] strm = ax0.streamplot(X, Y, U, V, color=U, linewidth=2, cmap=plt.cm.autumn) fig0.colorbar(strm.lines) plt.show() plot() |
Your end result should look something like the following:


