Killer Frost... Don’t send a Mathematician to do a Meteorologist’s Job
by Daphne Thompson, on Dec 16, 2015 9:38:33 AM
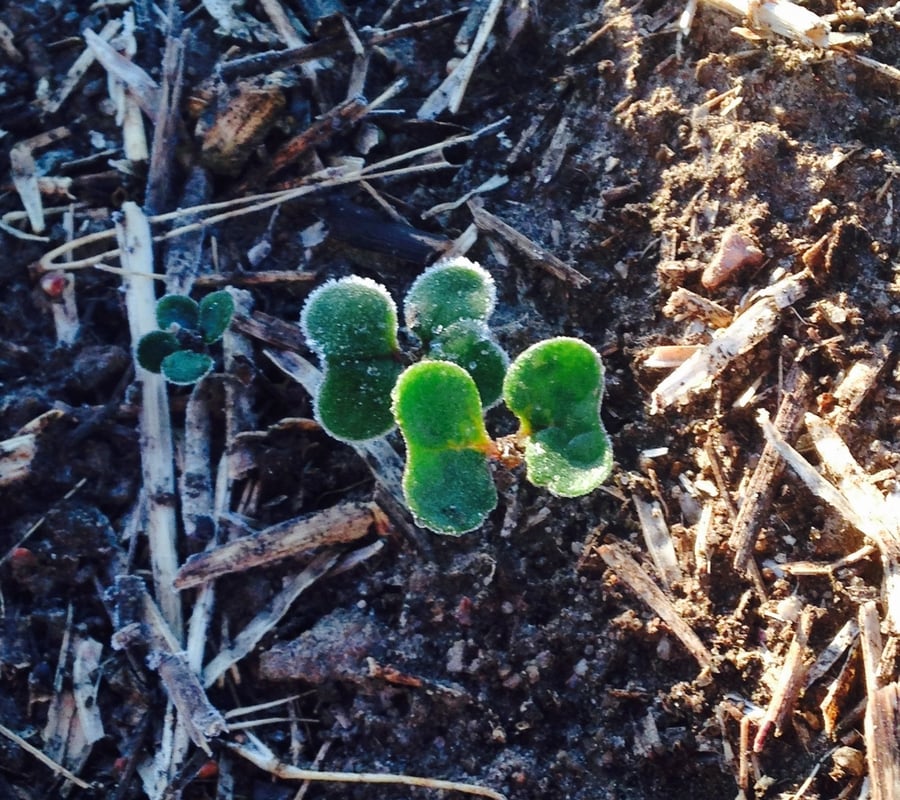
A frost blankets over 25 million acres in early June, well past canola seeding in most parts of Saskatewan. 1000s of acres had to be reseeded and the growing season had to start over again. Growers awoke that morning snapping pictures like the one below and wondered:

Image Courtesy of Agri-data Solutions
How did this happen?
The stations showed overnight it didn’t even get close to freezing with the lowest temperature in the area indicating it was +5 C. So growers checked another weather source that uses a curved linear approach to temperature and found temperatures ranging +7 and +5 C, hardly the temperatures for a killer frost.
For years growers have relied on weather stations to know what’s going on at the field level. Yet, we all know that in the above example, stations can fail to capture a shallow frost. There are some providers who utilize a mathematical approach called linear analysis combined with terrain to show temperature. Meaning, if one station is 42, the other is 38, the temperature in the middle is 40 and may follow elevation in terrain.
Is this a good enough answer?
Linear analysis works when you compare things like gray hair and if someone is above or below 40 years of age. They’re yes or no answers. Unfortunately, weather is not a yes or no answer when compared with something like terrain. Weather moves along terrain as fluid, and as such, means its variations are complex.
Don’t send a Mathematician to do a Meteorologist’s Job.
Linear analysis is a quick and dirty mathematical way to analyze the weather that is more accurate than stations alone but still doesn’t accurately answer what the weather is like at your specific location. Weather Decision Technologies takes the time to combine both observations and numerical weather models in real-time to create a high resolution grid of the current weather. It's computationally challenging to produce a gridded product every 30 minutes and requires expertise in weather to combine these products.
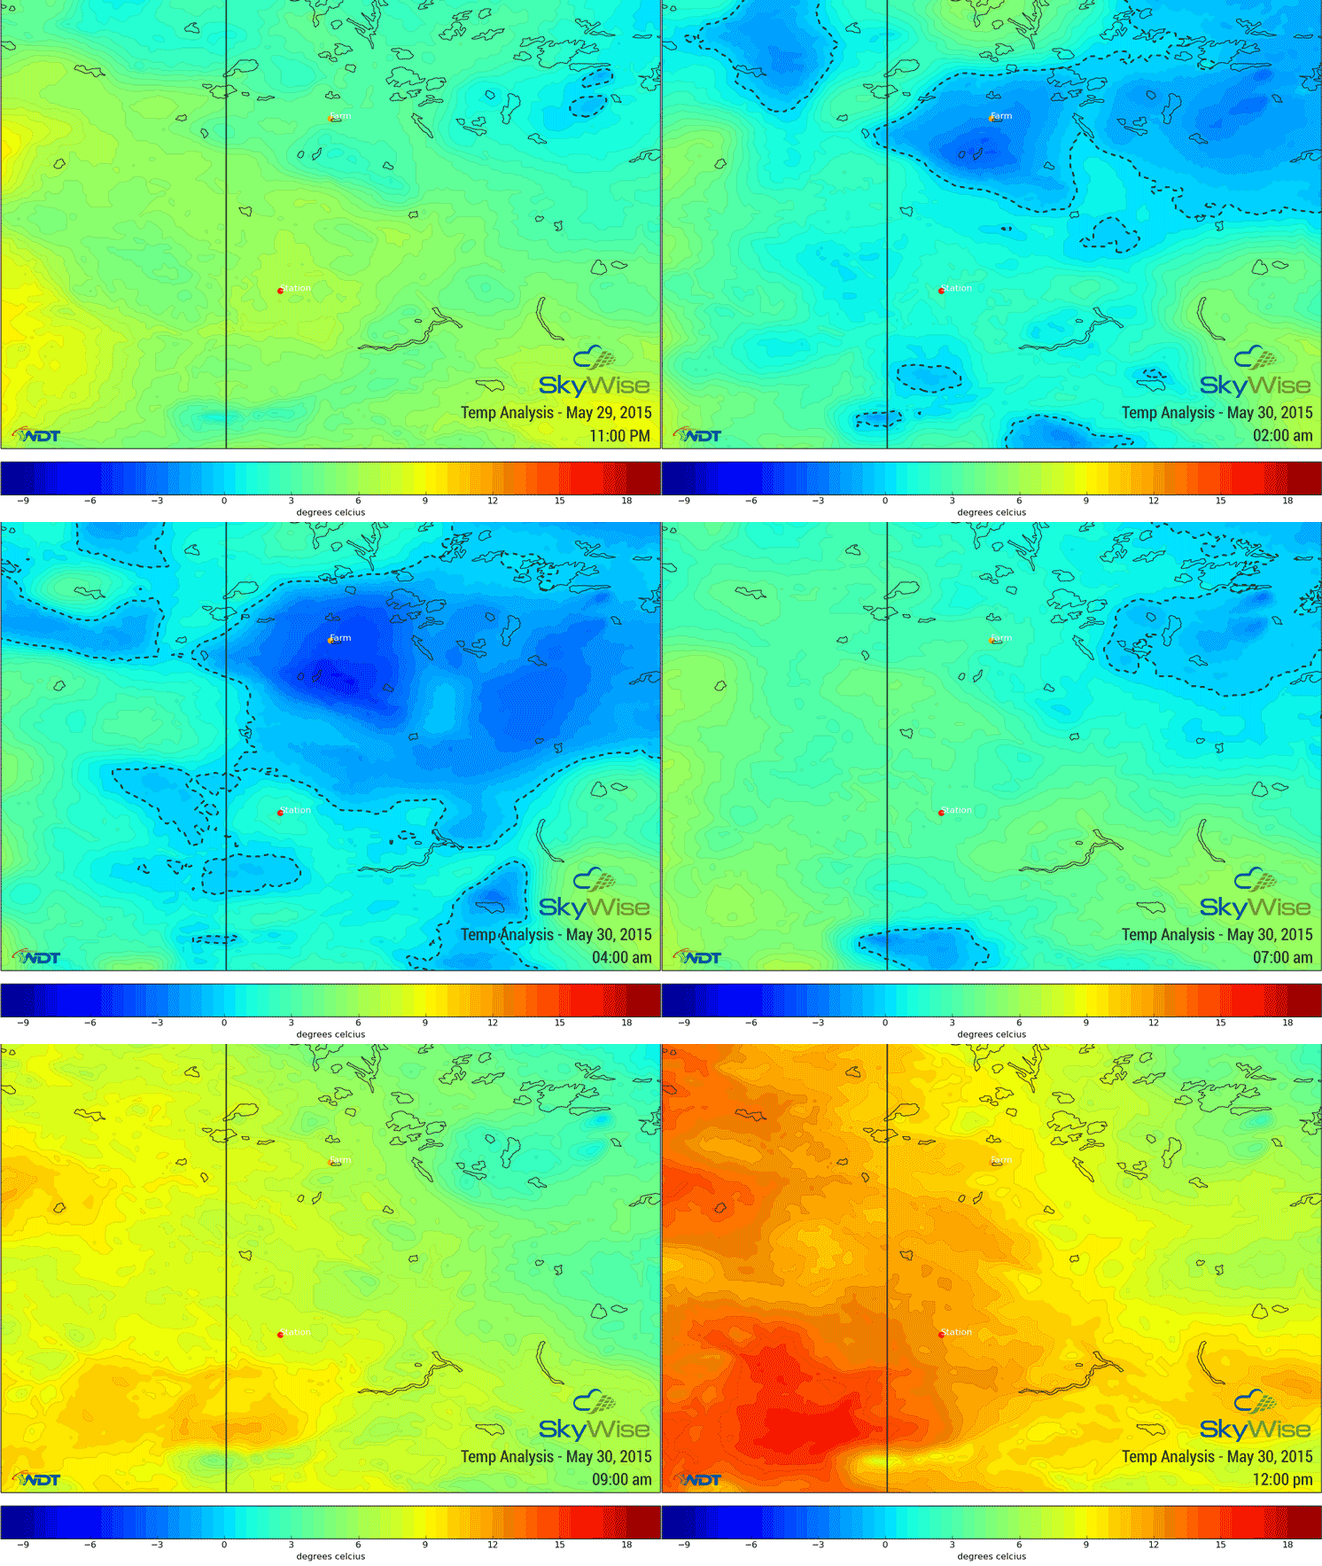
Looking at the plot, its quite easy to see where the station failed to correctly showcase cold air. The coldest temperature registered by the station reached 1.4 C and never hit the 0 C line (as seen by the dashed black line). Yet very quickly one can see how the farm experienced below freezing temperatures from 1am-7am using WDT's analysis.

While others catch up, we lead the scientific advance. We strive to have the most accurate weather data in agriculture. Our analysis product correctly captured 6 hours of temperatures below freezing in this frost event, the same data that’s used to initiate our local high resolution forecast models providing lead time for these growers. While others were warm, we were able to give the cold hard truth to why the frost happened. Contact WDT today to learn more.


