How to Use Weather Data to Estimate Energy Demand - HDDs and CDDs
by Stephen Strum, on Mar 22, 2017 1:16:46 PM
Do you know how to use weather data to estimate energy demand with respect to Heating Degree Days (HDDs) and Cooling Degree Days (CCDs)? Weather is the primary driver in energy demand variability as variations in temperature across the country dramatically influence the amount of energy consumed to heat and cool homes and businesses. Colder weather in winter will increase demand for heating fuels such as natural gas, heating oil and propane while hotter weather in summer will increase demand for electricity and thus the fuels used to produce that electricity, such as coal and natural gas. Since the price of energy commodities, such as natural gas, is largely related to their supply and demand, weather data can help predict price movements as well as the underlying supply and demand levels.
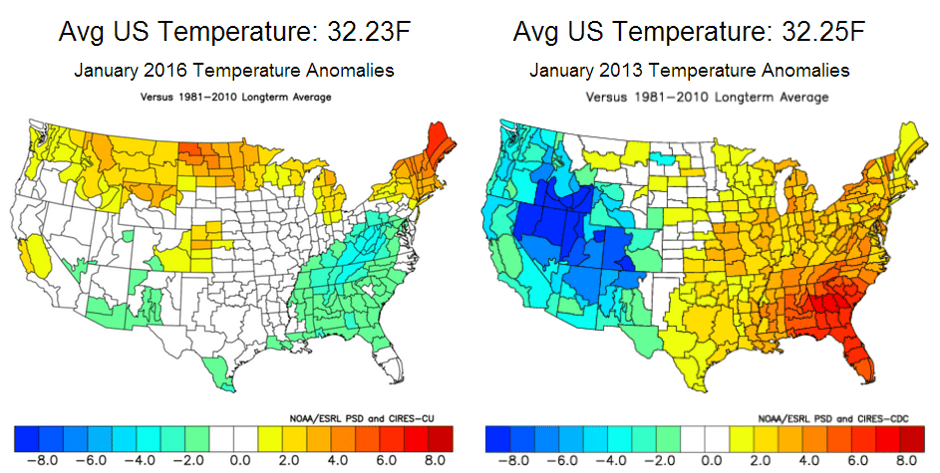
The first obvious step when trying to estimate energy demand is to compare average temperatures to energy demand levels. Temperatures can be averaged across specific cities or regions, or aggregated across the entire country to try and estimate energy demand levels on a larger scale. While this can provide a good first indicator, it can hide the true levels of energy demand, on both the local and national scales. The example below shows maps of temperature anomalies for January 2016 and 2013. The average US temperature (reported by NOAA) was nearly identical in both months, yet the pattern of temperature anomalies was dramatically different. Much more of the country was above normal in January 2013, but the more widespread warmth was counterbalanced by stronger cold anomalies across portions of the western US. January 2016 saw fewer extremes, with most of the country averaging closer to normal.

Since the more heavily populated eastern US saw more warmth during January 2013 than in January 2016, US total heating demand was less in January 2013.
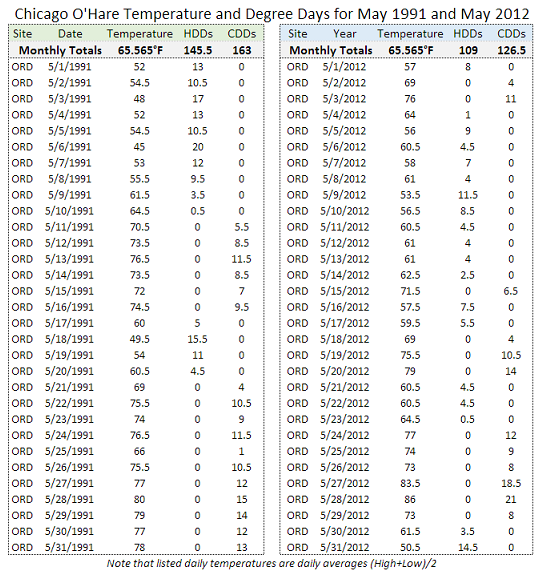
Even if two months have very similar average temperatures at a given location, the resulting energy demand can be drastically different. The table below shows a great example of how much an average monthly temperature can hide the true nature of a given month’s weather. May 1991 and May 2012 both had identical average monthly temperatures at Chicago O’Hare: 65.565°F, yet May 1991 had far larger swings in temperature. May 1991 had 9 days with a daily average temperature less than 55°F versus only 2 days during May 2012. May 1991 also had 9 days with a daily average over 75°F versus only 6 days during May 2012. Since there is generally little demand for heating or cooling when the average temperature is around 65°F, deviations from that level are important for overall levels of weather related energy demand. May 1991 had 18 days that were more than 10 degrees above or below 65°F, but May 2012 only had 8 such days. The net result is that May 1991 saw 10 more days with meaningful levels of heating and cooling demand compared to May 2012, despite similar average temperatures.

To help account for important weather variations that can be lost in the data when looking at averages, Heating Degree Days (HDDs) and Cooling Degree Days (CDDs) are often utilized. HDDs are most often defined as 65°F – (Daily High + Daily Low)/2, with HDDs set to zero if the value is negative. CDDs are most often defined as (Daily High + Daily Low)/2 – 65°F, with CDDs set to zero if the value is negative. So, neither CDDs nor HDDs can be negative, and a given day can only have one or the other, not both. HDD and CDD values are then summed up over months and years, not averaged. In the previous table, while both months had the same average temperature, May 1991 recorded 145.5 HDDs and 163 CDDs in Chicago, both much higher than the totals from May 2012 of 109 HDDs and 126.5 CDDs. So, by looking at the HDD and CDD totals it becomes apparent that May 1991 likely had much more demand for heating and cooling of homes and businesses than May 2012 in the Chicago area, despite the similar average temperatures.
While analysis of HDD and CDD totals provides a better picture of what the likely weather related energy demand was during a particular month or season, they are not perfect. The balance point used in HDD and CDD calculations is 65°F, since that is a level where heating and cooling demand are minimal. However, the actual temperature where heating or cooling demand begins does vary by region because of differences in building codes and other factors. Additionally, just as the monthly average temperature can hide the actual weather volatility seen during a given month, so can the daily average temperature used to calculate the HDD and CDD values. A day where the daily high is 70°F and the daily low 50°F would have a daily average of 60°F and 5 HDDs. Another day might have a high of 90°F and a low of 40°F, and still have an average of 60°F and 5 HDDs. However, the second day likely had more heating demand in the morning and likely had some cooling demand in the afternoon as air conditioners kicked on when temperatures soared. While days with such large swings might be uncommon in a place like New Orleans, they are not at all unusual across much of the interior western US where the drier air and higher elevation allow temperatures to vary much more readily. Even areas that don’t normally see such large swings may still have days when frontal passages produce similar results.
Even though HDD and CDD calculations may not be a perfect metric for estimating heating and cooling demand, they are one of the easiest methods to use, and thus tend to be the most popular. In the next part of this series, we will examine different ways HDDs and CDDs can be aggregated on a regional and national basis to provide useful heating or cooling demand indices that can then be compared to actual energy consumption data.


