Clean Radar Makes for Easier Decisions
by Matt Gaffner, on Apr 22, 2016 11:54:21 AM
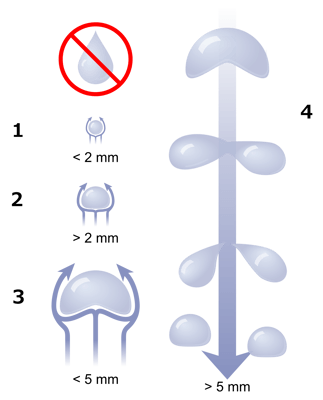
Recently WDT published a blog about the shape of raindrops. It’s a very interesting fact that most people don’t know what the true shape of a raindrop is because we’ve all seen raindrops drawn like teardrops our whole lives.

Aside from being interesting, that simple fact has HUGE implications in the field of meteorology. Knowing that large raindrops are much wider than they are tall
is the basis for many of our dual pol radar algorithms. One of the biggest improvements you can see in WDT’s radar products is due to our ability to quality control radar data. Most folks are used to seeing easy-to-interpret maps of radar data on interactive web maps or TV news stations; however, the data doesn’t come that way.
Radars are extremely sensitive instruments and can pick up very tiny particles in the atmosphere over 100 miles from the radar. These particles can be raindrops, hail stones, snowflakes, dust, smoke or even bugs. The sensitivity is amazing! However, when you’re looking at radar in order to see where it’s raining, you don’t want to see anything that’s not rain. Radar data that is cluttered with pixels that don’t represent precipitation can be confusing and hard to view. Most people have enough experience with radar data that they can generally tell when rain is coming and whether or not they should think about going inside. To the untrained eye, some clutter may actually look like strong storms. WDT wants to empower users of our radar data who may not have a meteorological background to make good decisions about the weather and how it may impact their lives and business. That’s why WDT works very hard to have the cleanest radar mosaics available.
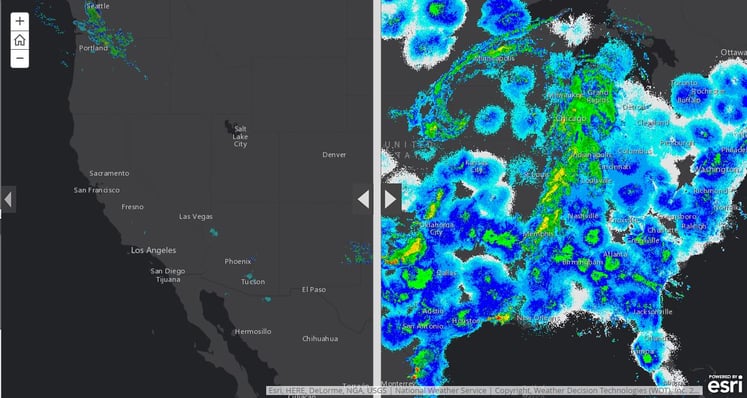
Using an ESRI Storymap, I’ve create an application that compares and contrasts real-time raw radar data to the radar data that WDT provides. Since the data update every 5 minutes in near real-time, the two radar data sets will not be the same for long, but you can always see a difference between the raw radar data and WDT’s quality controlled radar map service that removes all of the clutter and non-precipitation pixels. If you pan the map or use the vertical bar in the middle to slide left to right, you can clearly see the improvement on the radar set.

If you’d like to add WDT’s clean radar data to your GIS or other applications contact us below.


