Automatically Correcting Bad Differential Reflectivity Data
by Noah Lock, on Aug 18, 2016 1:36:26 PM
Heavy rain fell for much of the past week across parts of the Gulf Coast, but by far the worst of the deluge was August 11-13 in Louisiana, where rainfall over 12 inches was widespread and some areas near Lafayette and Baton Rouge approached or exceeded 24 inches.
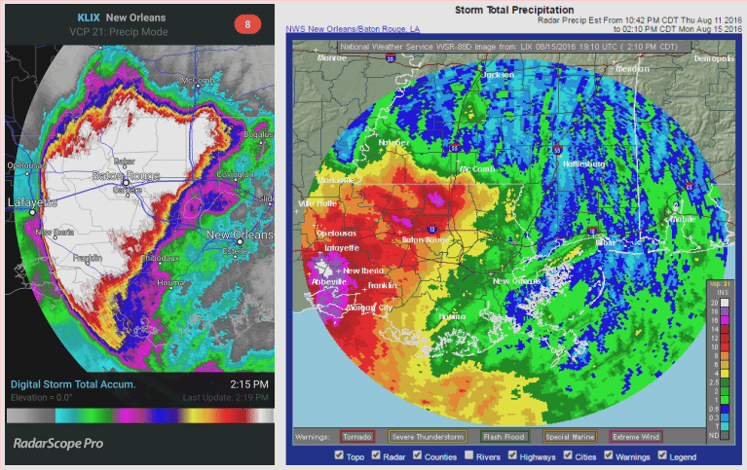
In an event like this, it’s natural to want to have a map that shows how much rain has fallen since it started. All National Weather Service radars produce a Storm Total Accumulation product, which is exactly that, the amount of rain estimated by radar since the start of the event (“event” start/end is usually based on the presence of sufficient radar echo). With the advent of dual-polarization, they now produce a dual-polarization-based Digital Storm Total product, as well as the legacy reflectivity-based Storm Total Accumulation product. Some people may have noticed that the Digital Storm Total precipitation estimate for the New Orleans radar (KLIX) was way too high during this event. In the screen shot below on the left, the large area of white is at least 40.6 inches, which is the largest value that can be represented in the file format used for these data. Though it rained a lot this weekend, it didn’t rain that much, and certainly not that much in so many places. The legacy Storm Total Accumulation displayed on the NWS website has much lower values for the same time period, all less than 20 inches (below on the right). These are generally lower than actually reported by gauges, but much closer to reality. So why the huge difference?

The main difference between these products is that the legacy version only uses reflectivity to estimate rainfall, while the new digital version uses dual-polarization variables such as differential reflectivity (ZDR) and specific differential phase (KDP) in addition to reflectivity. These extra variables provide additional information about characteristics such as the shape of the drops and the total water content along the path of the radar beam, and this information generally improves the precipitation estimate. However, in this case, the ZDR was being severely underestimated by the New Orleans radar. In general, lower ZDR means higher rain rates for the same relatively high reflectivity. This error in ZDR led to an error in the precipitation rate calculation with each scan, and when those errors are added up over a few days of heavy rain, the total error is very large.
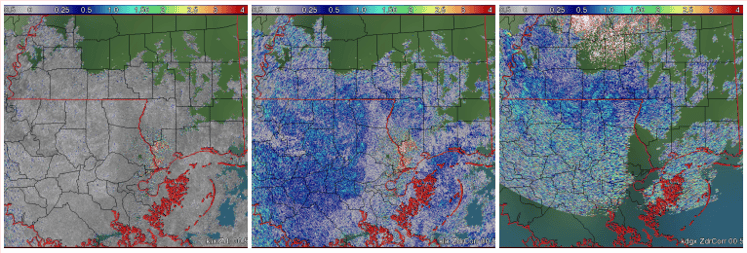
The radar team at WDT has frequently observed this type of ZDR error at the New Orleans radar (and similar kinds of errors at other radars) and the effect on precipitation estimates. Many months ago, we devised and implemented a method to automatically correct for them to prevent gross errors in the precipitation estimates. Our method uses the routine data disseminated by the NEXRAD network to produce correction values that update every hour and are automatically applied to the raw ZDR data for each radar before it is used for hydrometeor type classification or precipitation rate estimation. During this event, the correction being applied to the New Orleans radar was approximately +1.2 dB (considering ZDR typically ranges from 0-5 dB in rain, an error of 1.2 dB is very large). Below are images of the ZDR before (left) and after the correction (middle), along with ZDR from the Jackson, MS radar for comparison (right).

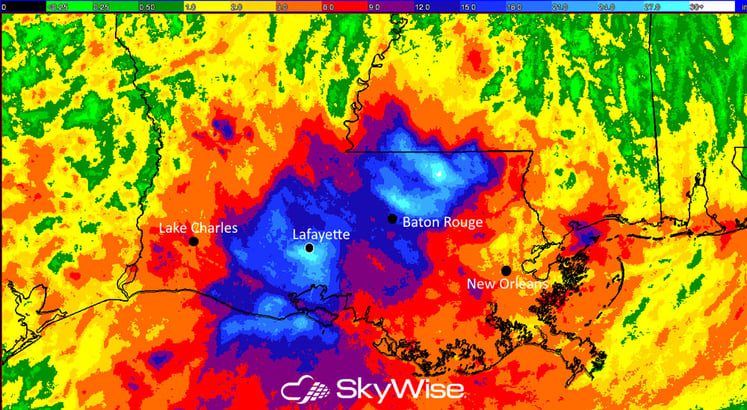
WDT’s storm total precipitation estimate (that uses dual-polarization radar data, gauges, and satellite) for the event is shown below. The maximum rainfall amounts near Baton Rouge are up to almost 30 inches, which is in better agreement with the gauge values (multiple 25 to 31 inch amounts NE of Baton Rouge) than either estimate from the New Orleans radar shown earlier. Thanks to our ZDR correction process, we are able to obtain the benefit from the dual-polarization data without being hurt by these persistent, systematic errors.


