by Daphne Thompson, on Oct 23, 2015 8:52:10 AM
Considerable media attention has focused on what has been described as a potentially historic equatorial Pacific Ocean basin-wide El Niño currently in progress. Astute readers also already know that no two El Niños are alike in terms of their evolutions and global weather impacts, and that there is a limited historical record for strong events (e.g., 1982-82 and 1997-98). In reality, there is a whole spectrum to ENSO, not just a “few categories” (e.g., super, strong, moderate, warm, cold, etc.).
So, what new information can be offered here? The purpose of this article is to contrast the most recent “Super El Niño”, 1997-98 with the ongoing warm event from a physical process-based perspective instead of an “index-based” (e.g., MEI or ONI) point of view. That is, to emphasize the importance of understanding physical behaviors and characteristics instead of relying on indices as a measure of comparison. The 1997-98 event is chosen because it is the most recent having available data sets such as from the TAO buoys and may help - by comparing to the ongoing El Niño - provide some insights about the role of climate change, including global warming. Furthermore, as they should, operational centers are leveraging the 1997-98 El Niño to help with seasonal outlooks going forward. As discussed below, there are substantial differences between the on-going El Niño and 1997-98 and we do not think the current event will be as strong as 1997-98.
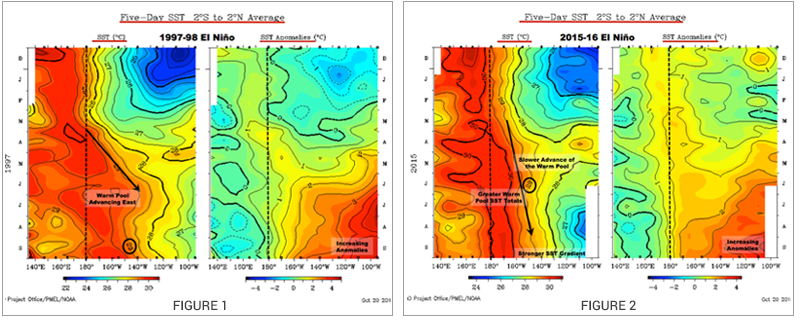
Figures 1 and 2 are time-latitude (or Hovmoller) sections of SST totals (left) and anomalies (right) for roughly the periods of December-September during the development phases of both El Niños (see captions). During spring 1997 the western Pacific Ocean warm pool made a significantly faster eastward advance (black arrow, 29deg C isotherm, left side of Fig. 1) compared to this past spring (left side of Fig. 2). Anomalies along the eastern Pacific Ocean cold tongue (lower right on Fig. 1) increased more rapidly with greater magnitudes during the fall of 1997 compared to so far this year (seasonal cycle favors cooling). Also observe that SST totals are greater just east of the dateline (vertical dashed line) along with a stronger gradient to the east compared to fall 1997 (more said below).
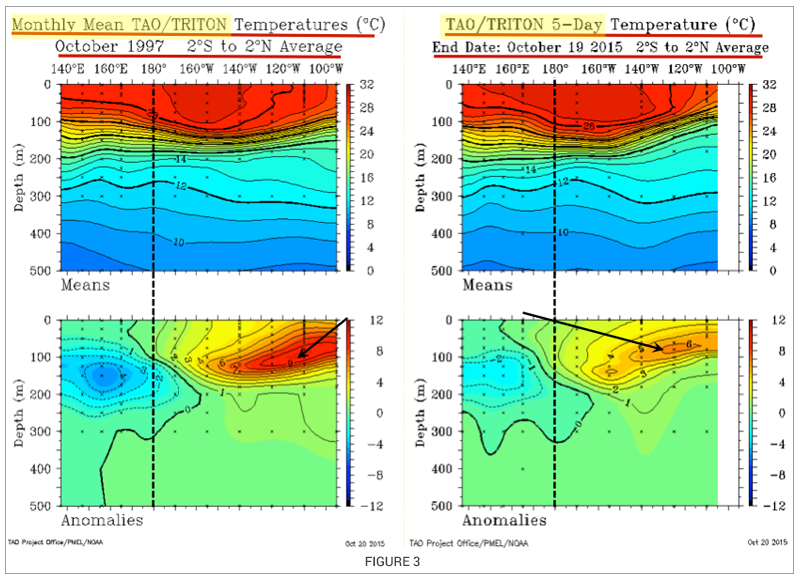 Figure 3 compares the subsurface anomalies along the thermocline for October 1997 (left) and the most recent 5-day average (right; differences in averaging periods understood). Notice that the 30-day averaged anomalous subsurface warmth (~10degC near 100m depth at 110W) is much greater than that at a similar location/depth for the ongoing El Niño. Furthermore, while respectable, the positive surface anomalies are not as deep nor is the thermocline slope as steep west of the dateline as this time in 1997 (larger cold anomalies west of the dateline). These differences in the subsurface structure help to account for the magnitude and rate of anomalous warming west of South America once that warmth is brought to the surface by the trade winds.
So, what is the point? The physical processes responsible for the subsurface warming for both of these events are completely different, especially with respect to the evolutionary time scales, and those differences are important not only when it comes to the ultimate strength of an El Niño, but also its impacts on the circulation. A key difference, to be discussed shortly, is that strong coherent MJO activity helped to drive the initiation of the 1997-98 El Niño, in contrast to episodic “noise events” for the ongoing El Niño.
During the early to mid-portions of March and July 2015 atmospheric processes involving tropical-extratropical interactions occurred which contributed to large projections in ENSO_RMM phase space (WH (2004)). The prevailing thought was that these signals were due to strong MJO behaviors. As shown below, these were not.
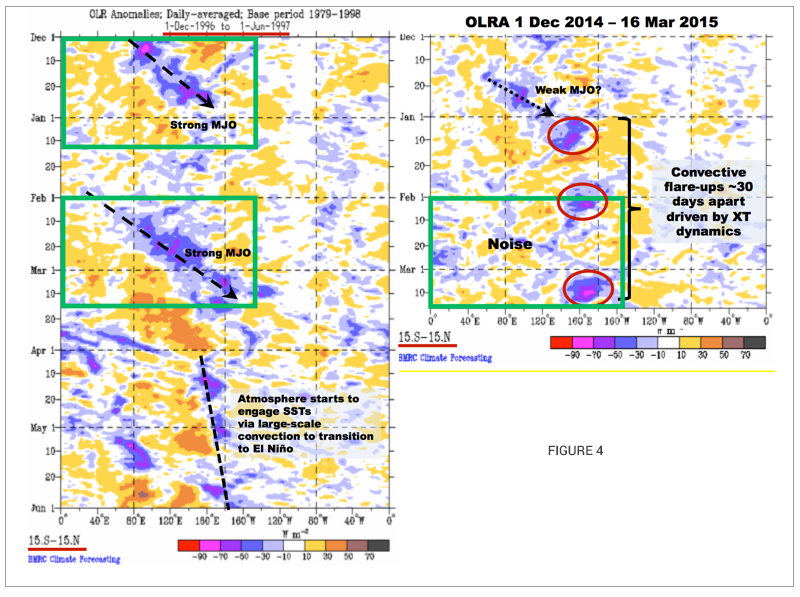
Figure 4 shows two time sections of OLRA (Outgoing Longwave Radiation Anomalies; a proxy for deep moist tropical convection), with 1996-97 on the left side and 2014-15 on the right (winter-spring seasons prior to the El Niño). The green boxes are for approximately the same time of year. During early 1997 a strong MJO (the second of 2 MJO events – see plot on the left side of Fig. 5) propagated into the western and central equatorial Pacific Ocean (enclosed by the green box), and provided a "kick" to what became an extreme El Niño event. Starting in January 2015 convective flare-ups related to extratropical dynamics (not shown in this post) occurred west of the equatorial dateline about every 30 days apart and progressively farther east. The March 2015 convective blow-up was the most intense up to that time, accompanied by a strong westerly wind burst (WWB; see Fig. 7). The western Pacific Ocean warm pool was systematically advancing east at that time and anomalously warm SSTs interacting with internal circulation dynamics (more said below) may have caused it. Notice the difference between the left and right panels of Figure 4. February-March 1997 involved a slow systematic eastward propagation of an envelope of enhanced convection as opposed to the noisy flare-ups for the same period during 2015.
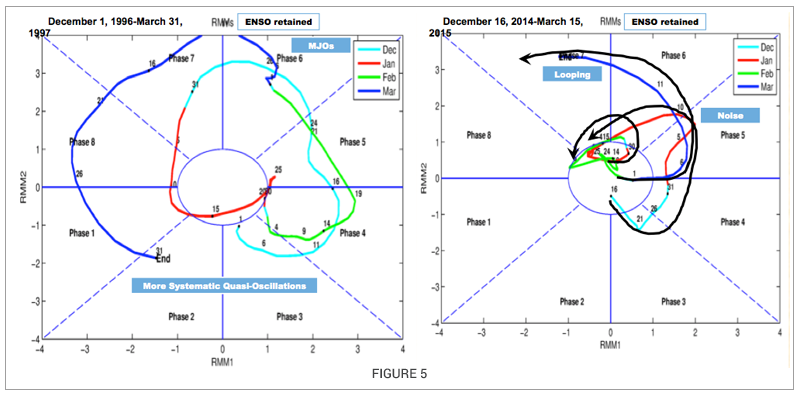 Figure 5 shows the full field including ENSO retained RMMs (Real-time Multivariate MJO Index; WH (2004)) for December-March 1996-97 (left) and 2014-15 (right). It is rather easy to contrast the quasi-oscillatory variations of 1996-97 to 2014-15. During 2014-15 there was looping, slowing down, sudden growth then decay, and so forth (shown by heavy black arrows). In fact, the latter could be symptomatic of noise within the system dependent on the characteristics of the flow itself (known as multiplicative or state dependent noise, perhaps the subject for a future post). The point is that literally countless other atmospheric behaviors involving tropical-extratropical interactions, including internal mid-latitude jet stream behaviors, can project in RMM phase space besides MJOs. Most numerical models that forecast the RMMs did a reasonably good job predicting the breakout into phases 6-7 during March 2015. This is suggestive that extratropical dynamics had a role since the models should perform well when circulation anomalies due to those processes are large and represented in their initial conditions. More will be said in future posts on how that can occur given the construction of the RMM phase diagrams.
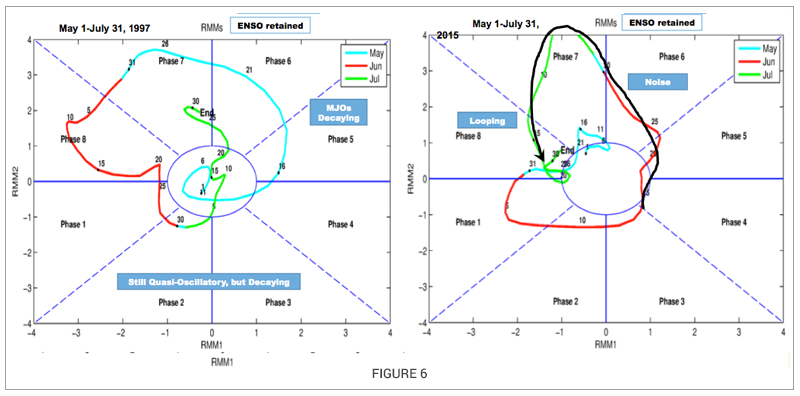 Figure 6 is the same as Fig. 5 except that for the period of May 1-July 31 of 1997 (left) and 2015 (right). During late June into early July a rapid growth into phase 7 occurred. Again, what is projecting in this phase space is a phenomenon that grows and decays in the same octant as opposed to a slow eastward propagating event.
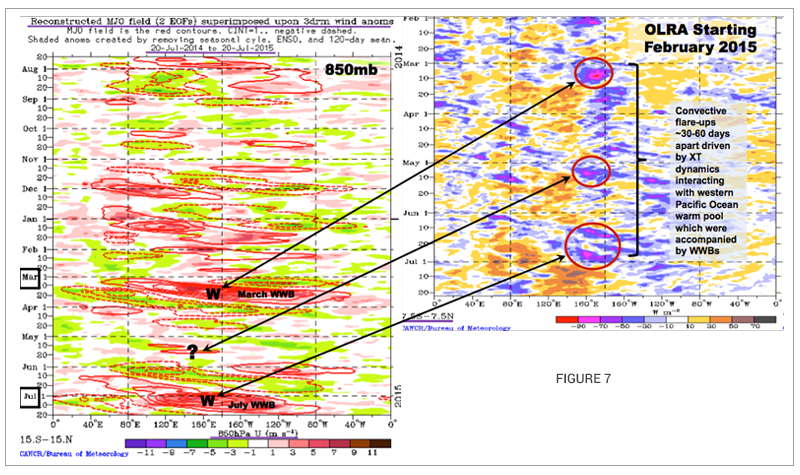 Figure 7 helps us to gain a better understanding of physical processes responsible for the large projection shown in octant 7 of the upper right phase space plot of Fig. 6. The left side of Fig. 7 is a time-section plot of three-day running mean 850mb zonal wind anomalies with the RMM contours superimposed (recall that the RMMs themselves are extracted from a data matrix that combines 850 mb zonal winds, 200 mb zonal winds and anomalies of OLR within the 15S to 15N latitudinal band). The takeaway is that a significant portion of the large projections during early March and July came from the westerly wind bursts (WWBs) themselves associated with the intense large-scale tropical convective flare-ups. On the right is a time-section of OLRA, where the negative anomalies (enhanced deep moist convection) associated with the WWBs were roughly 60 days apart. The convective flare-ups are annotated by the red ovals (~30 days apart -- multiple time scales!). Notice that these flare-ups are episodic and by mid-April were apparently embedded in envelopes of enhanced convection involving fast time scales. Those fast time scales did project onto atmospheric Kelvin waves (KW) per coherent modes time-sections (not shown). However, daily monitoring suggests extratropical dynamics were involved via Rossby wave energy dispersions (RWDs), and the temporal characteristics of the OLRA envelopes involved with the flare-ups are clearly different than the MJO shown on the left side of Fig. 4.
Furthermore, there was also a convective flare-up during early May, yet no WWB. Why not? That is open question. The point is that the convective flare-ups and WWBs, while involving a relatively slow time-scale, are random!
Summarizing, during the winter of 2014-15 the western Pacific Ocean warm pool was very slowly advancing east (Fig. 2), and it is reasonable to speculate that internal circulation processes (including noise/stochastic forcing) were working to maintain that evolution. While daily monitoring showed that extratropical wave energy flows were involved, the details and causes of those "internal circulation processes" are a major research issue. Those processes did lead to a basin wide El Niño by this past spring. It is also reasonable to speculate that the dynamical processes responsible for the WWBs helping to transition the climate state toward the current El Niño were apparently much more complicated than those associated with internal mode MJOs, like that seen during 1996-97.
The takeaway here is that slow ocean forcing from the WWBs caused by the 1996-97 strong MJOs may have helped that El Niño develop and gain strength more rapidly. While its ultimate strength and duration are to be determined, the current El Niño cannot be said to have benefited from the same. Understanding in real-time the physical distinction between coherent systematic MJOs and random processes, and their respective roles in forcing ENSO has not only made a difference in the subseasonal outlooks issued by this office (e.g., warmer temperatures nationally this past summer), but also the expectation that the 2015-16 El Niño will not be as strong as 1997-98.
Recalling Fig. 2 and the discussion above, the warmer SSTs near and immediately east of the dateline (>30deg C) this past summer compared to 1997 (compare left sides of Fig 1 and Fig 2) is likely related to global warming. There has been increasing evidence from the refereed literature that the increase in SSTs across the western Pacific Ocean warm pool has contributed to a stronger SST gradient and cooling to the east (La Niña like). That may result in stronger trade winds and work against El Niño. This office has speculated (and supported with in-house work) that La Niña–like physical processes tied to climate change have also been working against the current El Niño, again suggestive that this event will not be as strong 1997-98. Stay tuned for future posts that address issues of climate change leading to La Niña-like global circulation and weather responses.
The bottom line is that it is important to understand the physical causes to any processes in the ocean-atmosphere system, including El Niño behaviors. Relying on simple metrics such as the MEI or ONI and comparing them to past events without getting into the details of the dynamical evolutions can/will lead to incorrect conclusions and have subseasonal/seasonal forecast implications.