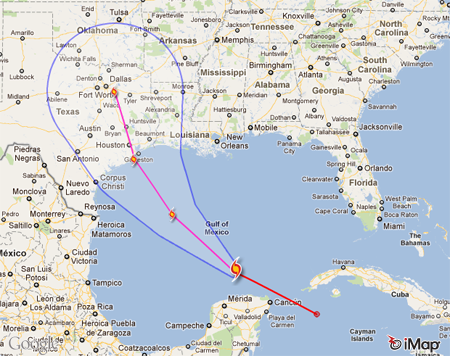
The Hurricane Cone of Probability
by Mike Eilts, on Jul 26, 2011 1:19:56 PM
Although I spent most of my career focusing on severe weather and its detection and nowcasting, I regularly observe how the National Hurricane Center (NHC) communicates threats from hurricanes, drawing corollaries with how severe thunderstorm and tornado threats are transmitted to the public. My impression is that the NHC has spent considerable time over the years working on how to represent hurricane locations to the public.
You may or may not know how the “hurricane cone of probability” produced by NHC is created. The cone represents the probable track of the center of the tropical cyclone and on average 67% (2/3) of the center locations will fall within that cone. They can calculate this cone because they assume that their forecast errors in the past 5 years will be the same as their existing forecasts.
I have always been impressed at how rigorous NHC’s approach is in calculating the probability cone. This is quite different than severe thunderstorm warnings or tornado warnings where local NWS meteorologists “on the fly” have to determine the size and location of the warning.
Of course there are issues in both approaches. If you think about the NHC cone of probability, if 2/3 of the forecasted center locations are within the cone, that means that 1/3 will be outside the cone. And I think that just as much of an issue is that the public interprets the area of the cone as the area where hurricane damage will occur, but that is not the case. NHC is representing where they believe 2/3 of the centers of hurricanes will fall, and hurricane force winds, surges, etc. definitely extend out from the center location by many miles.
On the severe thunderstorm and tornado warning side, the size and location of the polygon is placed in such a way that the meteorologist believes that the hazardous weather will always occur within the polygon. It would be interesting to see statistics on what percent of tornadoes for example occur outside tornado warnings, but my guess is that number will be very small. The biggest issue with tornado warnings is false alarms.
So all in all, communicating information to the public about hazards from hurricanes and severe thunderstorms and tornadoes is a difficult task. Meteorologists producing these warnings and forecasts have to deal with the reality that inherently all forecasts of meteorological events are by their nature not perfect. Thus, in the meteorological community we try to express the hazards to the public by making warnings or cones of probability larger in size and time than will ever actually occur to cover the uncertainty in our capability to forecast these events. Ultimately, progress in science and our capability to collect data on these events will help us reduce the uncertainty, leading to more precise and accurate warnings and forecasts.


