by Nicholas Hunter, on Jul 6, 2018 1:55:00 PM
We are adding new features to our tile-based lightning display API, including support for Vector Tiles. These additions will allow fast, custom styling of lightning data in a map.
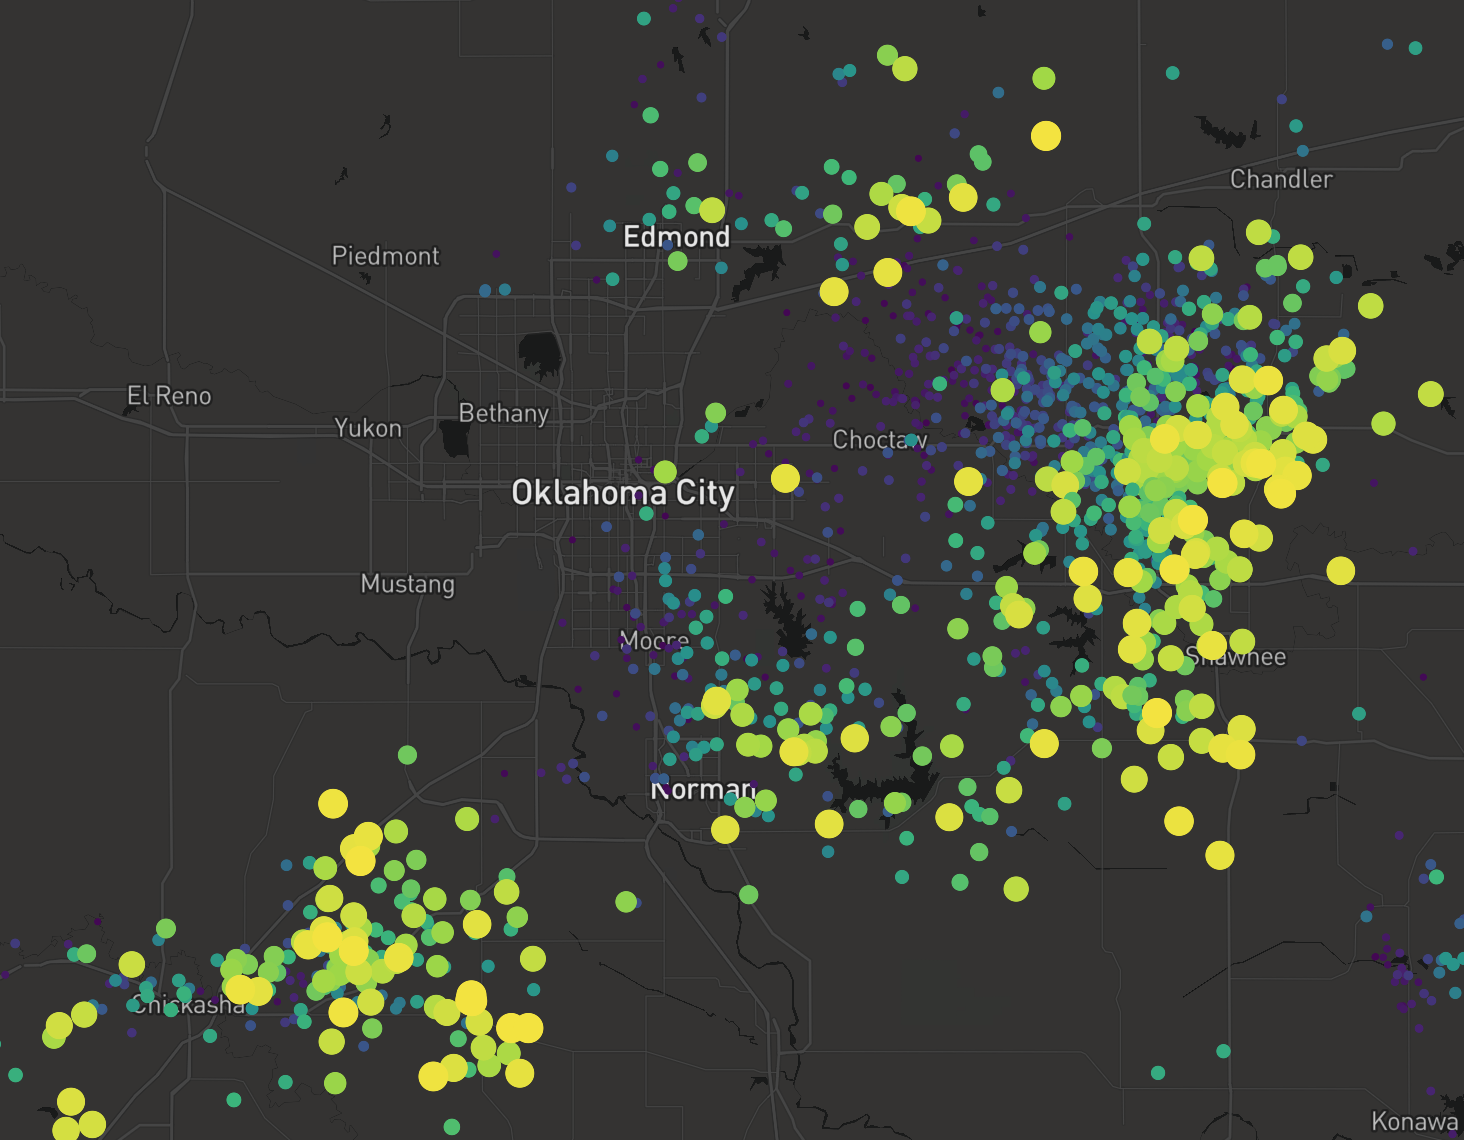 Vector Tile Lightning Events with Size and Color Interpolated by Strike Age
Each tile contains a moving window of lightning strikes within the last 30 minutes. Lightning strikes are available for display typically within 15 seconds of the event, meaning strikes beyond 3 miles away could likely be visualized before the thunder is heard.
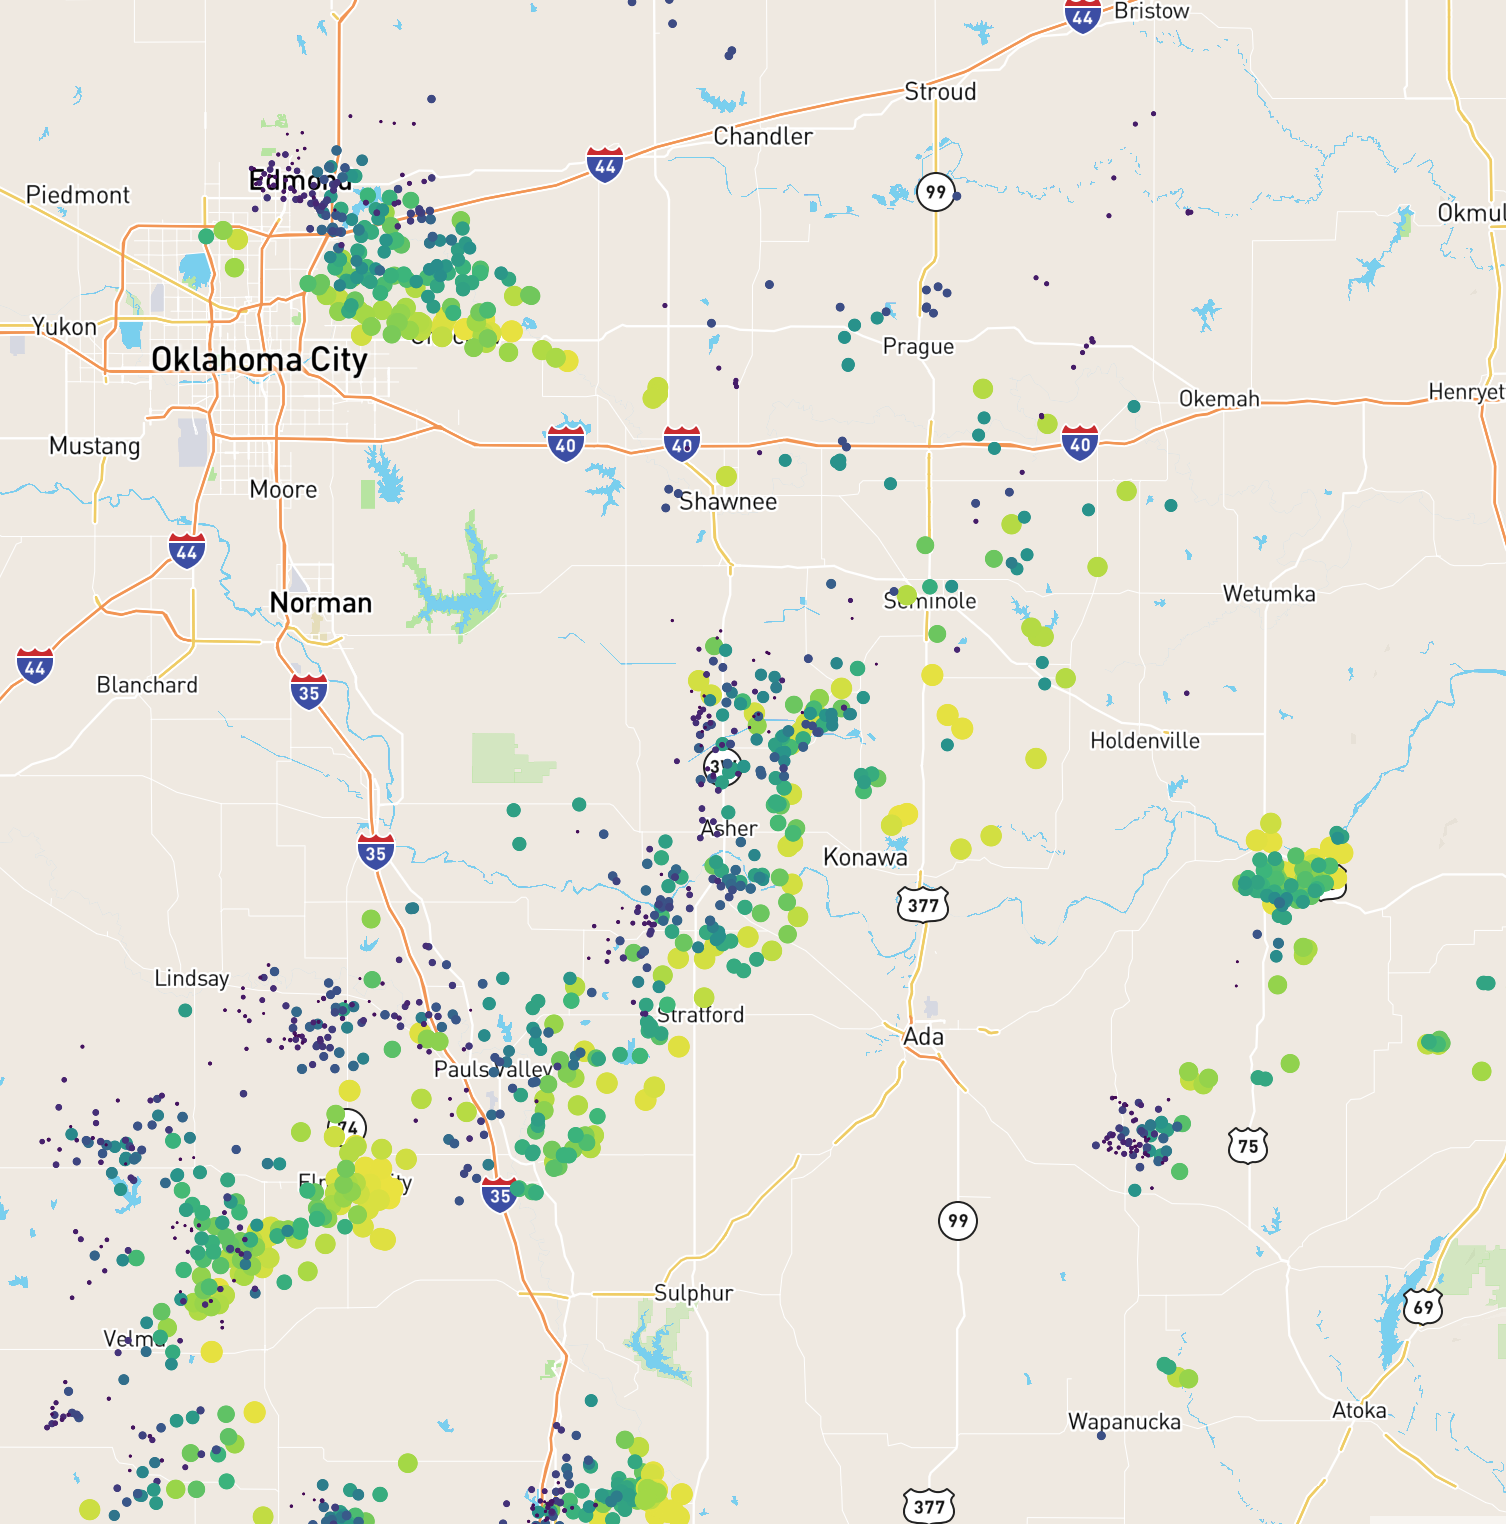
Vector Tile Lightning Events with Size and Color Interpolated by Strike Age
Mapping clients such as Mapbox GL JS or ESRI Vector Tile Layer support different data-driven styles for vector tiles such as the styled points above or the heat map below.
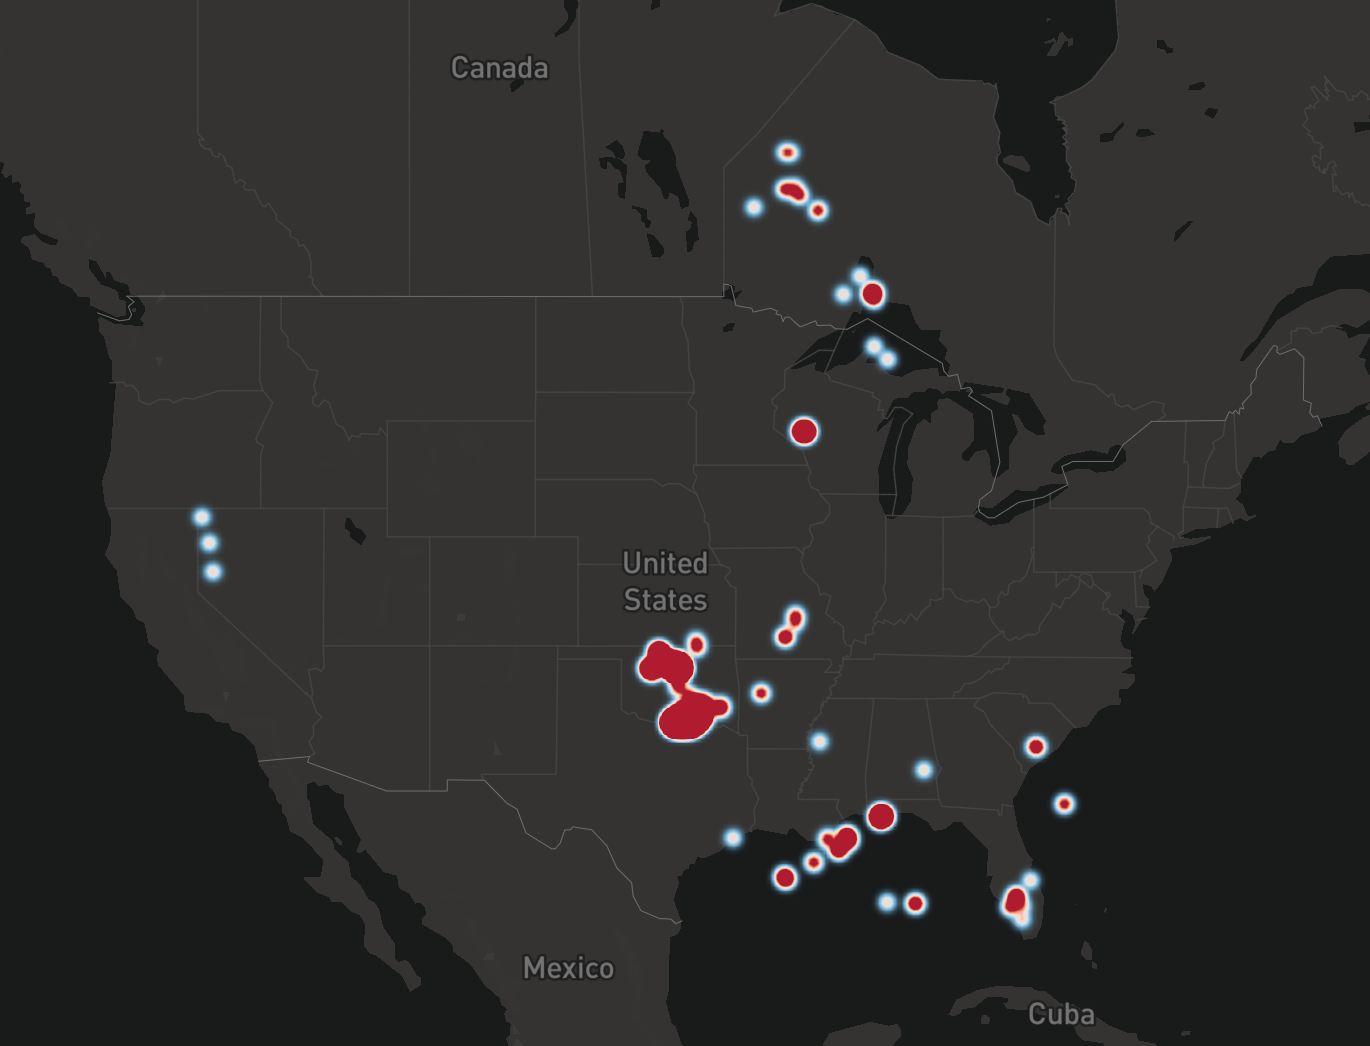 Style Points Using a Heat Map in GL Maps
Since the volume of strikes can be incredibly large within an area when looking at an entire continent, the API uses progressive disclosure to reduce the amount of data sent to the client. This process keeps response times fast and prevents overwhelming a mapping client application. Users can zoom in on their map to view additional details. At street level, map users typically see every lightning event.
WDT also offers the application WeatherOps Commander for businesses and the Weather Radio mobile application which both use the same lightning display service.