


 Comprehensive weather insights help safeguard your operations and drive confident decisions to make everyday mining operations as safe and efficient as possible.
Hi-Res GIS Weather Layers Are Essential to Business and Government
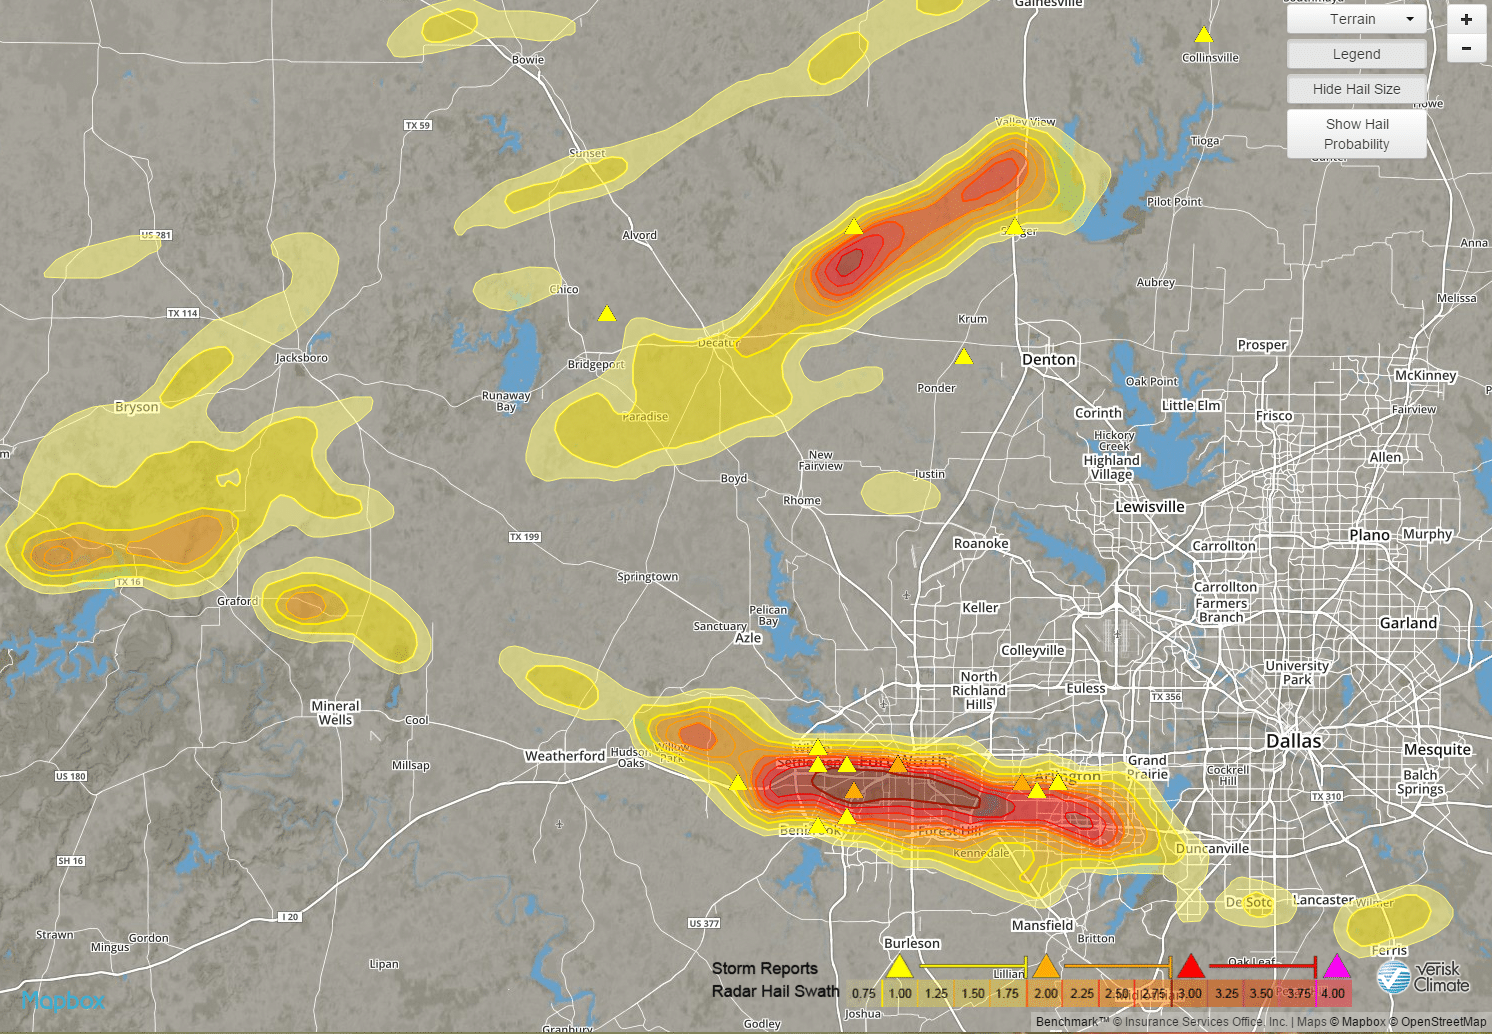
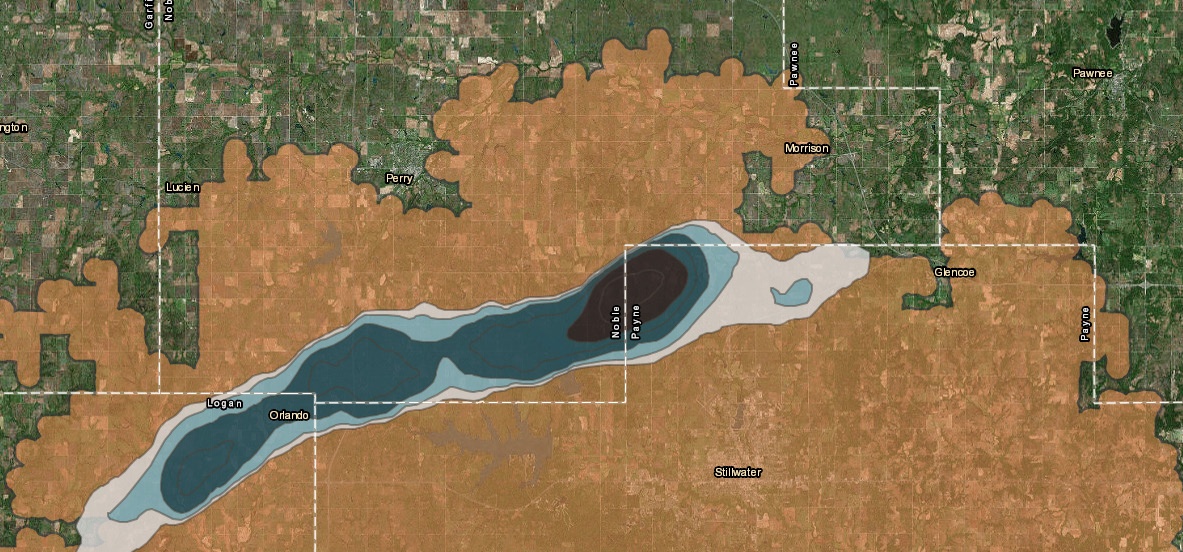
Today’s marriage of advanced weather information and analytics, along with ever-evolving mapping abilities, produces capabilities once unimaginable. It’s now possible—from the comfort and convenience of any computer or smart device—to “see” golf ball-size hail descending upon on a rural intersection, to identify specific geographic areas under the gun for heavy precipitation, or to determine whether lightning has struck within 250 meters of a specific location.
These innovations are possible because of recent advancements both in the weather industry and in ESRI’s GIS mapping software, the most powerful mapping and spatial data analytics technology available. ESRI’s ArcGIS can now assimilate volatile data, such as fast-changing weather information, and display it in a stunningly high-resolution that allows users to spatially examine data in an interactive manner like never before.
For companies with weather-vulnerable assets dispersed throughout the country and across the globe, these combined technologies provide the capability to monitor the occurrence and threats of all types of meteorological hazards concerning a company’s assets. This ensures that assets remain productive, staff are safely deployed, and operations are conducted as efficiently as possible.
The value that this technology brings is so significant that DTN has made a substantial investment in the development of GIS weather layers that can fully exploit the potential. These layers can show us—at a glance—a wide range of weather phenomena and exactly where they’re located. As a result, we’re able to deliver timely weather risk data to the fingertips of those who rely on this information for critical business decisions.
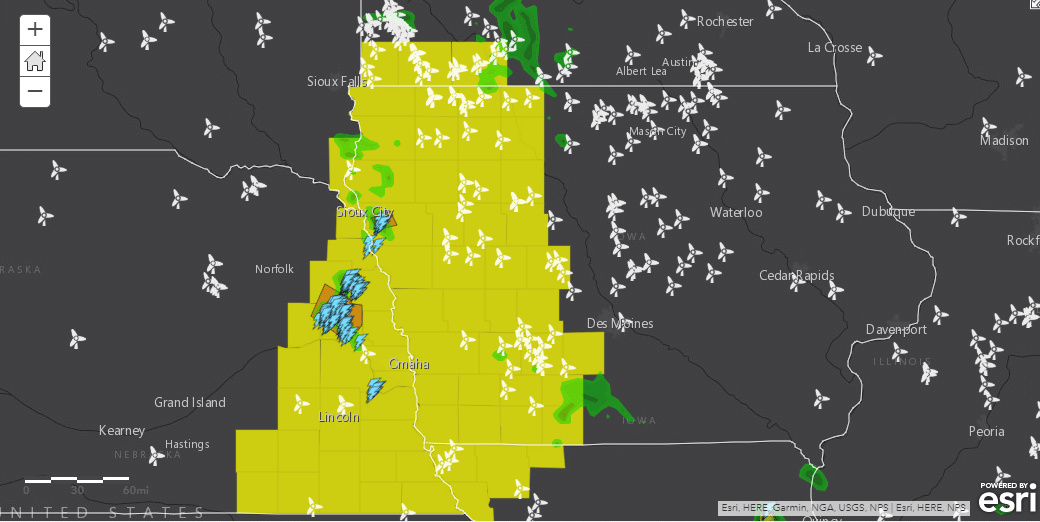
There’s almost no limit to the amount of weather information and analytics that can be displayed. Some of the GIS layers include radar (past, current, and future), lightning (current, historical and predicted), tornado tracks, hail swaths, tropical storms, thunderstorm and severe weather outlooks, temperatures and precipitation (forecast and accumulation). National Weather Service watches, and warnings and DTN proprietary alerts are also incorporated into the maps for additional reference.
The practical application of this information is wide-ranging. Many of our customers, representing industries from energy to renewables to public safety to insurance, have found WeatherOps GIS to be a useful tool in safeguarding assets and improving operational efficiencies.
ONEOK, an energy service provider whose operations include a 38,000-mile integrated network of gas pipelines, uses GIS for situational awareness. Desktop alerts can be set up to provide information about specific weather risks at specific locations that may cause interruptions to operations, such as lightning, heavy rain, cold outbreaks or other severe weather. ONEOK also uses historical surface observations to build models that ensure that gas in the pipeline is moving as efficiently as possible based on weather demand and weather conditions.
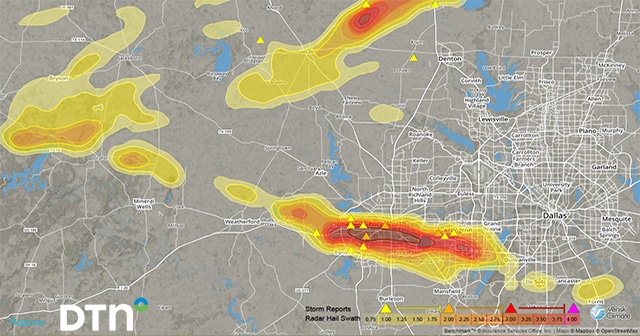
The United States Automobile Association takes advantage of GIS weather layers to track hail swaths for logistics and claim verification. With sophisticated modeling—along with the use of advanced map functions—it can also estimate the number of claims that a storm might create.
There are many other applications for the weather content provided as GIS layers. Our tornado product has been used in real time for utilities and pipeline operators to help identify assets potentially affected. This can reduce the human resources needed to scout for damage, restore services more quickly, and expedite cleanup and containment efforts for any hazardous materials impacted. Tornado overlays can also be used by first responders and emergency managers to manage assets and plan response.
Weather analytics mapped to specific locations can also help agricultural concerns. For example, a 10-day, high-resolution forecast of quantitative precipitation can help with decisions about when to irrigate, when to use pesticide, and whether fertilizer is likely to gradually penetrate the soil or wash away under heavy rain.
We are truly on the cusp of revolutionary changes in how weather information is depicted, interpreted and consumed. With remarkable advances in mapping capabilities and weather analytics, decision-makers have unprecedented access to weather information that can impact their operations. While the vagaries of Mother Nature can never be controlled, today’s innovative tools at least allow us to work in concert with it.